
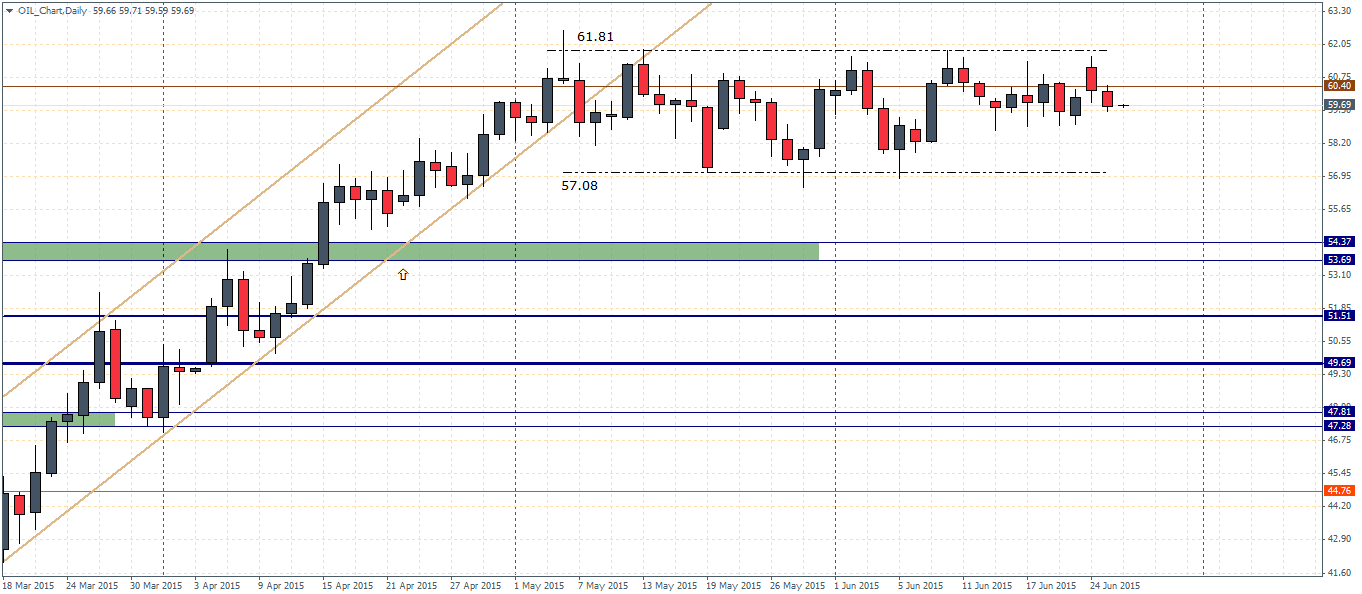
Crude Oil remains range bound between $61.81 and $57.08
Crude Oil futures continue to trade sideways, marking close to two months of trading within the range of $61.81 – $57.08. On the daily charts, the most recent candlestick pattern has however printed a bearish reversal pattern and we expect this could potentially set the stage for another test to the lower end of the range at $57.08.
On the monthly charts as well, Crude oil price action looks poised for a possible spinning top/doji pattern after bullish price action in April previously. A bearish close from the current highs could potentially kick off another fresh leg of the bearish decline with the support at $43.5 being the support level that could be tested.

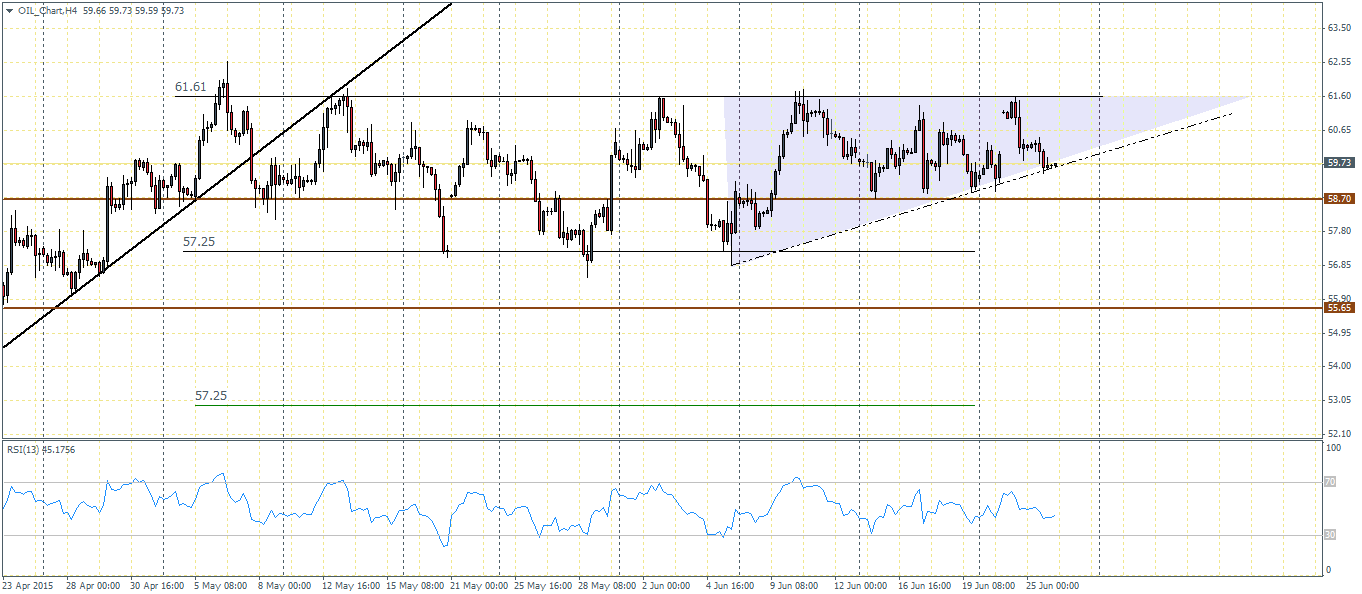
On the intraday charts, we notice a potential ascending triangle pattern being formed with price action currently testing the rising trend line. A break out above $61.61 could possibly set the stage for a continued rally to the upside. In the event the trend line is broken, support at $58.7 will be tested ahead of a decline down to 57.25. However, our bias remains to the upside should $61.61 breaks.
Fundamentally, Crude oil futures were under pressure as the US EIA released the weekly Crude oil inventory report. For the week ending June 19th, stockpiles rose by 680k barrels, beating estimates by a large margin. Besides the rise in inventories, the Oil markets are also under pressure on account of the Greece crisis and its potential fallout on a default.
Later this month, on June 30th, the Iran nuclear deal is expected to reach its deadline and a positive outcome could see the West lift sanctions on the country which would be positive for Iran and its oil exports. This would potentially flood the markets with an additional 1 million barrels per day putting more pressure on the supply side of the markets, which could possibly push prices much lower from current levels.
Overall, the current ranging price action is likely to indicate a potential break out from this level which could possibly establish the next leg in the Crude oil prices.
In this aspect we do have the potential ranges that Crude oil could traverse. To the upside, watch for the break of the ascending triangle above the current resistance at 61.61, while to the downside, a break of the trend line will see initial support hold prices at 58.70, which could then set the stage for 55.65 support.

