
The US Dollar Index is still not out of the woods yet as the trade weighted index attempts to trade near 96.90, a critical support and resistance level where price needs to establish support before any attempts to push higher. Over the week, the Greenback got a boost largely due to better than expected housing market data with existing, pending and new home sales all rising across the board to post fresh gains seen in months. Economic data across other sectors are also showing modest signs of recovery and one that could keep the bullish momentum going. Even the Core Durable goods orders that have been volatile in the past few months to the downside, managed to post some decent prints this week with the Core orders rising more than expected.
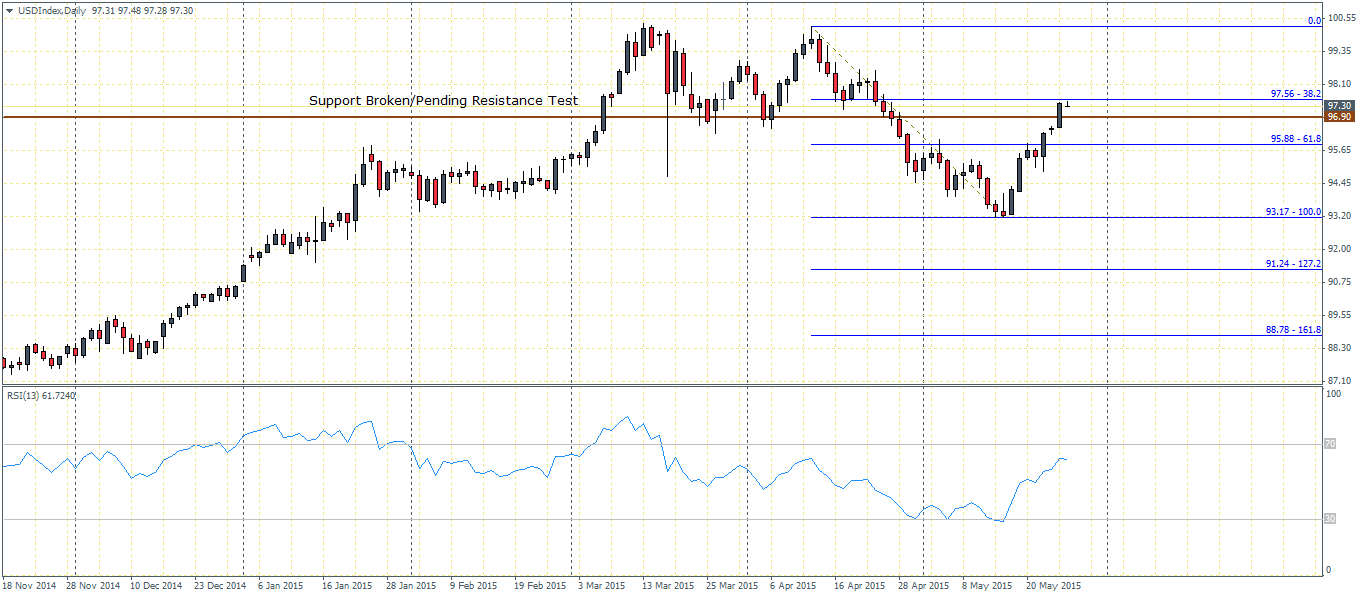
In our previous analysis, we mentioned that the price level near 96.9 or 97 will be an important level to watch. At the time of writing, the US Dollar Index managed to break above this level yesterday to close at 97.39. Today and perhaps the remainder of the week will be important in terms of whether price will manage to be supported above the 97 handle.
The breakout to the upside came after price formed a bullish engulfing candlestick pattern on the daily charts on 22nd May with two consecutive bullish closing prices after that as illustrate by the daily chart below.

Switching to the 4-hour chart time frame, we notice that the bullish divergence to the RSI saw prices rally after seeking support near the 95.25 – 95 price level. The rally from this support took prices to break above 96.55 a 4-hour support level with the next resistance/support coming in at 97.6 after price managed to break across both the falling trend lines. From the 4-hour chart time frame, we expect to see a close above 97.6 and perhaps a test of support as well to ascertain that the US Dollar Index is indeed on its way to post fresh highs and could possibly break above the 100 psychological price level.
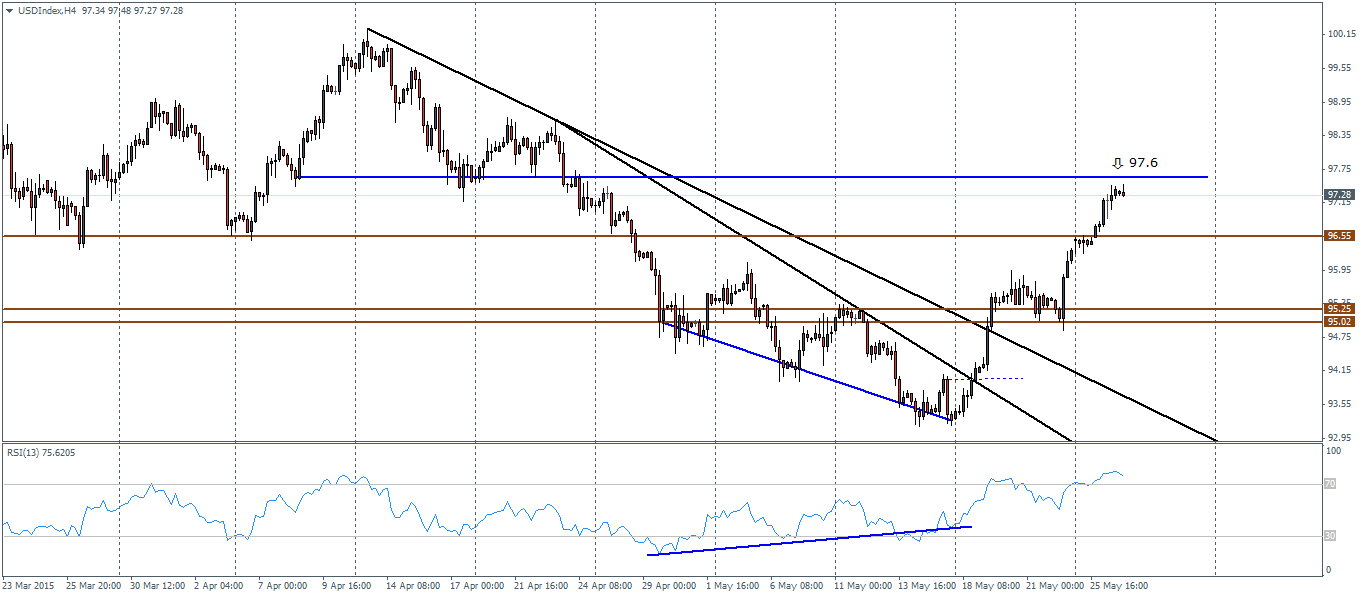
In the event that prices fail to push higher, we could see some consolidation near 96.55 and possibly a decline back to 95.25. A break lower is needed in order to see the US Dollar Index decline.
Looking forward, the main risk to the US Dollar comes from the second estimate revised GDP for the first quarter of 2015 which is due to be released this Friday. Expectations, heading into the event is for the revised GDP to show contraction by -0.9%. It will be hard to ascertain how the US Dollar would react to this news, which is already quite stale and considering that the most recent FOMC minutes and speech by Fed Chair Janet Yellen has largely overlooked this temporary slump. While the GDP data is likely to bring some volatility, combining the fundamental event with the technical levels mentioned earlier in this article could provide traders with some early clues into the future price action.
For the moment however, it does seem that the US Dollar Index has probably completed its correction as we wait for the charts to confirm support near 96.5 – 97 price level which could then see the Greenback attempt to break above the 100 level.

![Credit Card 160×600 [EN]](https://assets.iorbex.com/blog/wp-content/uploads/2023/06/13144507/Blog-Banner_EN-Banner_160X600X2.webp)