
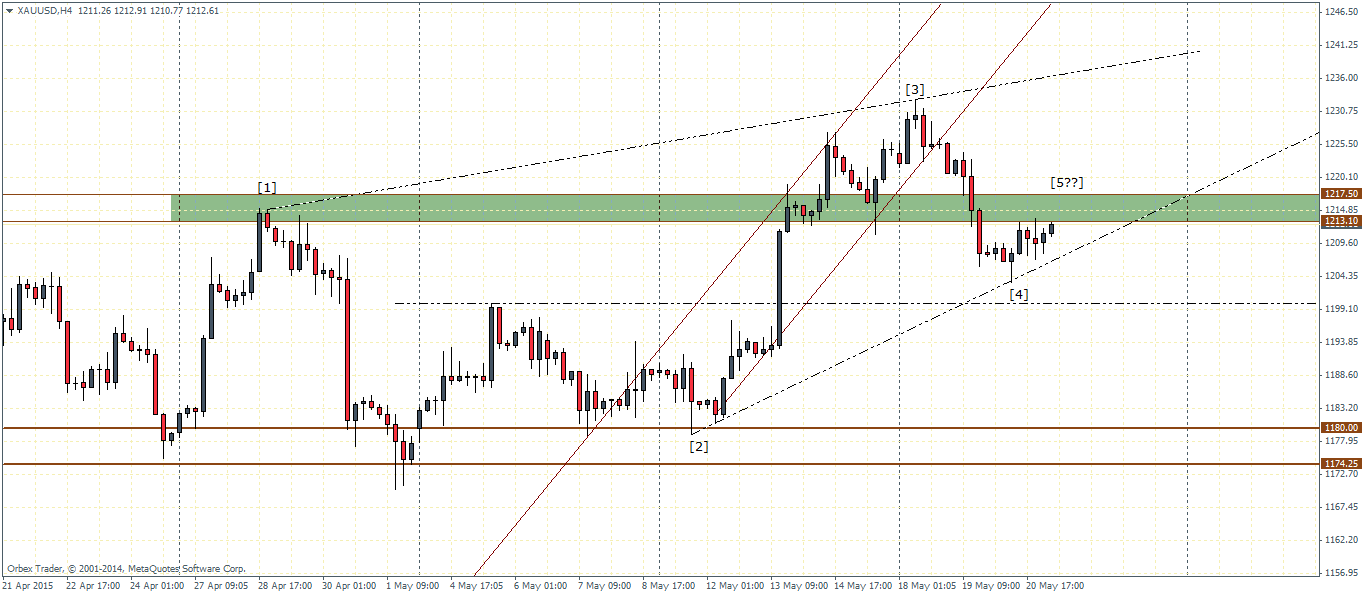
Gold futures have been quite resilient in the past few weeks and for the most part failed to break significantly below the 1200 handle, making this psychological round number an important price magnet.
The 4-hour chart time frame for Gold shows a large consolidation taking place identified by the rising wedge pattern. So far we have all the characteristics qualifying the rising wedge pattern and as such, focus is now on how price reacts to the support/resistance zone between 1217.5 and 1213.10.
Simply put, failure to break above 1217.5 will see Gold prices likely to decline lower with 1200 being the first support level followed by 1180. On the other hand, should prices see a successful rally above 1217.5, we could expect to see further gains to at least 1230.75 price level which marks the previous high.
Also of importance and one which highlights the critical nature of the support/resistance zone between 1217.5 and 1213.10 is the fact it is also identified via the rising price channel where prices broke out from the top near 1230.75.

Any bearish candlestick patterns either on the H4 or daily chart time frame will offer early clues towards potential declines to the downside.
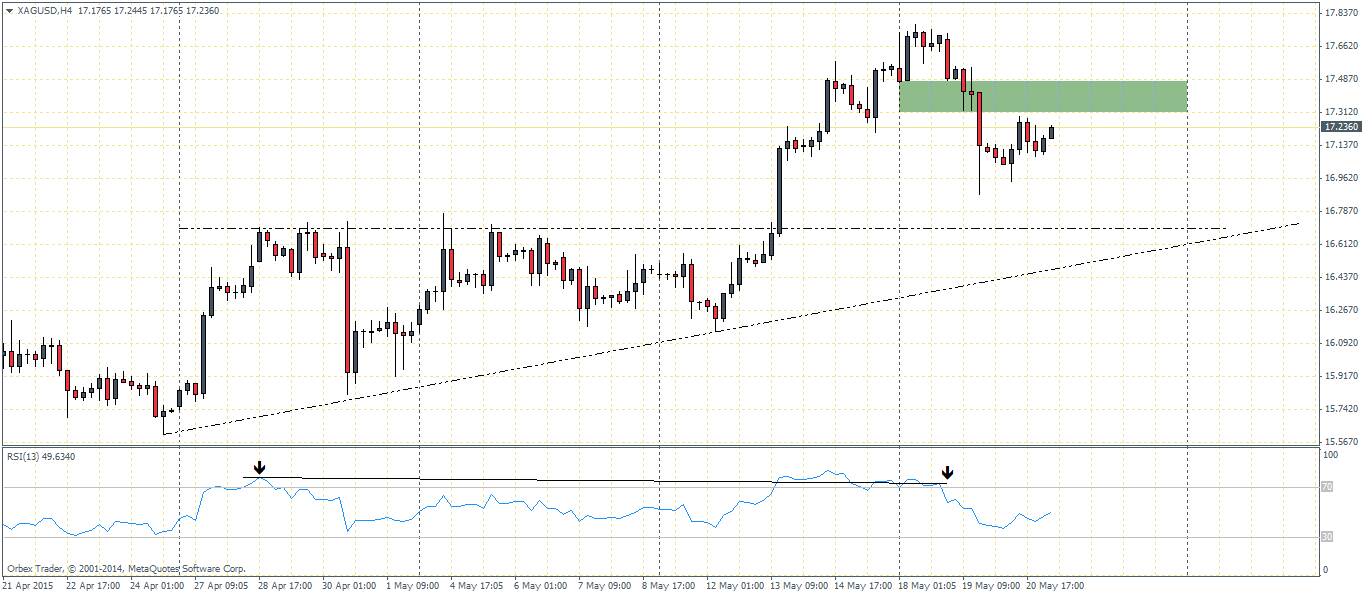
Silver futures have also been quite volatile in recent times putting to question the bearish trend from a larger perspective. Looking to the preferred H4 time frame, we understand that Silver prices broke out from an ascending triangle chart pattern. The break out from 16.7 resistance zone, saw a sharp rally which led Silver to test above the 17.66 price zone.
Currently, we notice a bearish divergence taking place as denoted by the lower high in the RSI. We do expect to see a possible retest to 17.48 through 17.312 price level, which if acts as resistance could confirm the bearish divergence. This will see Silver prices likely to decline and retest the broken resistance at 16.7
Fundamentally, there are no major events that are likely to affect or influence the price action in Gold or Silver futures, from a geo-political perspective, which leaves us with the other variable being the US Dollar.
While the Greenback has been weakening for the past couple of weeks, the recent rally seen just a day ago has somewhat silenced the USD bears. With the FOMC meeting minutes risk done with and no major takeaways from the Fed’s minutes, the focus will continue to remain on the Greenback’s underlying strength. Technically, the US Dollar is still poised for more correction to the downside which should help support the Gold and Silver prices. Of immediate risk in this aspect is today’s US existing home sales and Philly fed manufacturing index followed by tomorrow’s CPI data, all of which could weigh in on the Greenback. So far, the US Dollar has been supported by a strong housing starts data but that makes up for just one piece of economic data that has managed to turn around the corner. Any possible blips in upcoming releases will likely see a renewed selling pressure mount on the Greenback.

![Credit Card 160×600 [EN]](https://assets.iorbex.com/blog/wp-content/uploads/2023/06/13144507/Blog-Banner_EN-Banner_160X600X2.webp)