Gold looks bearish on a break below 1200
Gold futures have seen a lot of consolidation in the past few weeks however the fact remains that prices of Gold remain poised to the downside in the medium to longer term. The first chart shows the daily chart for Gold futures. Plotting the price action with the Pitchfork tool, we notice the consolidation taking place near a major support level of 1200 through 1190 regions. A break below this level looks imminent, although a more preferred confirmation would be to see a strong bearish candlestick from the current levels.
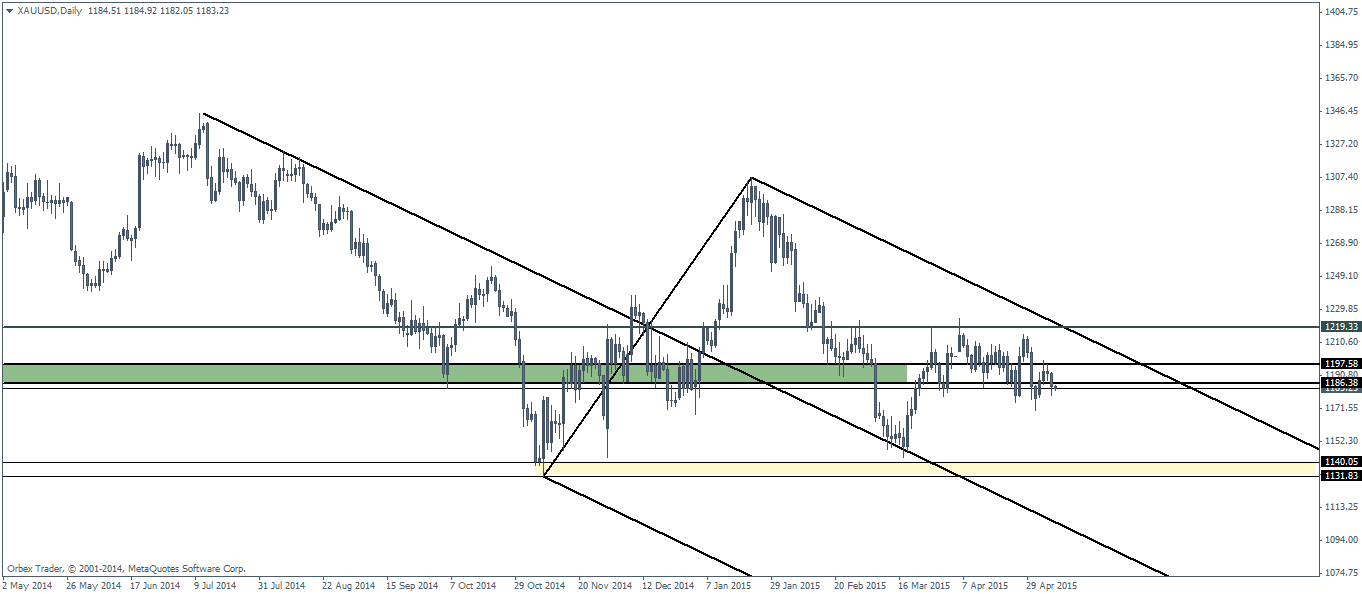
This could confirm a decline with the downside target at 1140.05 through 1131.08 levels which sits close to a previous reversal at this price.

On the weekly charts, price hasn’t moved much and there are no clear candlestick patterns formed either. The range between 1202 through 1171 marks a consolidation level within the longer term support.
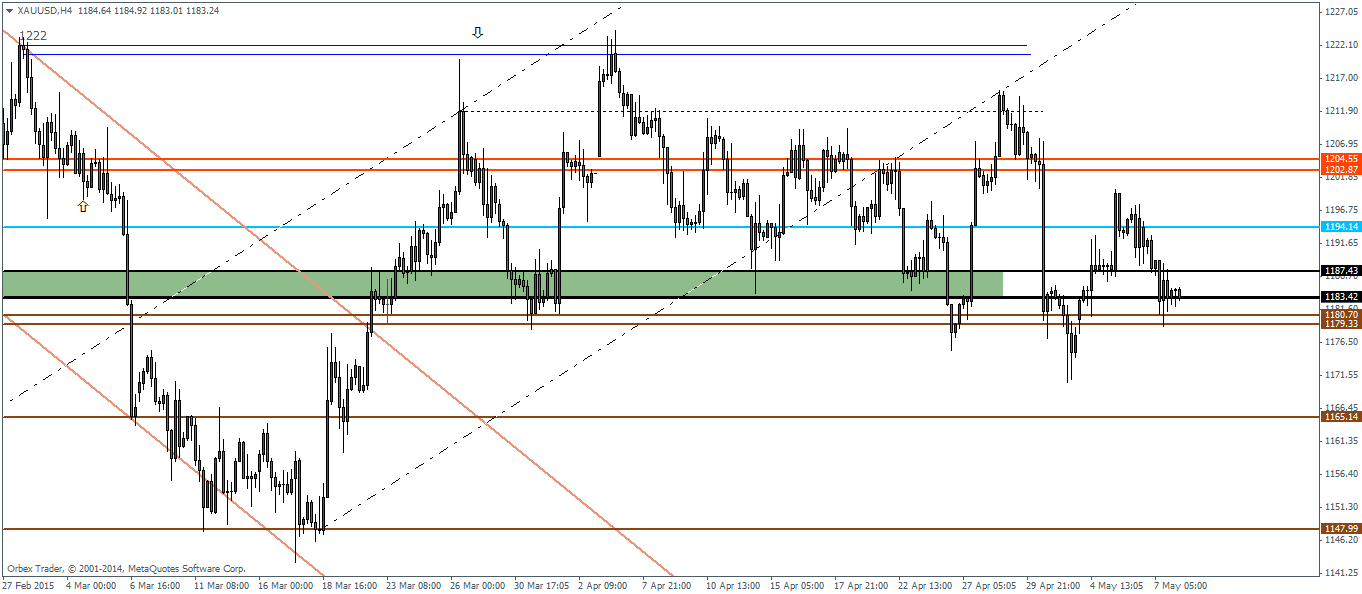
Finally, looking to the 4-hour chart, we can notice that after price broke the rising price channel, it quickly declines to 1187 only to reverse and test the break out level. Price rallied a bit higher but failed to post new highs and reversed gains near 1211.90. At the time of writing, Gold futures are back to the support zone and below 1183, targets a minor support at 1180.70 through 1179. This will be the level to watch as a break lower could see Gold decline towards 1165 and 1147.
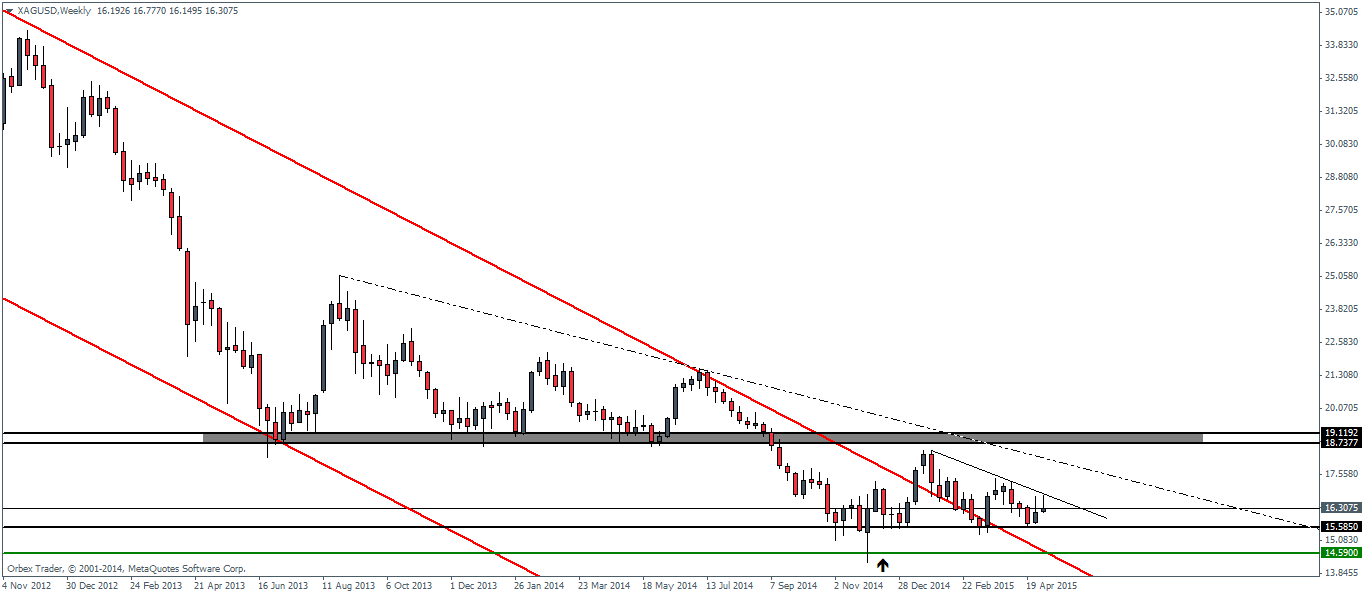
Silver continues to consolidate within the right shoulder
Silver futures managed to retrace some of its declines after forming a peak in the right shoulder of the larger head and shoulders pattern on the daily charts. Price action managed to retrace close to 16.81 just a few points near a minor double top formation. The fact that the previous peak of the right shoulder at 17.09 could not be breached shows that the bearish reversal pattern is still on the cards. However, declines to test the neckline at 15.5 are essential to pave way for more declines lower.
From the weekly charts, price action hasn’t really moved much in recent weeks and has been mostly ranging for its part. The minor trend line plotted connecting the highs from 25/01 through 05/04 this year should offer an initial glimpse into the price movements. A break above this minor trend line is a clear indication that from the weekly charts price could possibly test higher. Major support comes at 15.58 on the weekly charts which need to give way to validate the head and shoulders from the daily charts and thus target 13.31, the projected move in Silver futures based on the head and shoulders pattern.