
The European trading session is relatively quiet with no major events on tap. This leads the markets to focus on the FOMC meeting minutes due later this evening. After yesterday’s volatility, driven by the ECB official’s comments on QE front loading, the Euro continues to remain subdued but looks to have eased from its strong bearish sentiment from yesterday. We could expect to see some modest sideways price action into the Fed’s meeting minutes today.
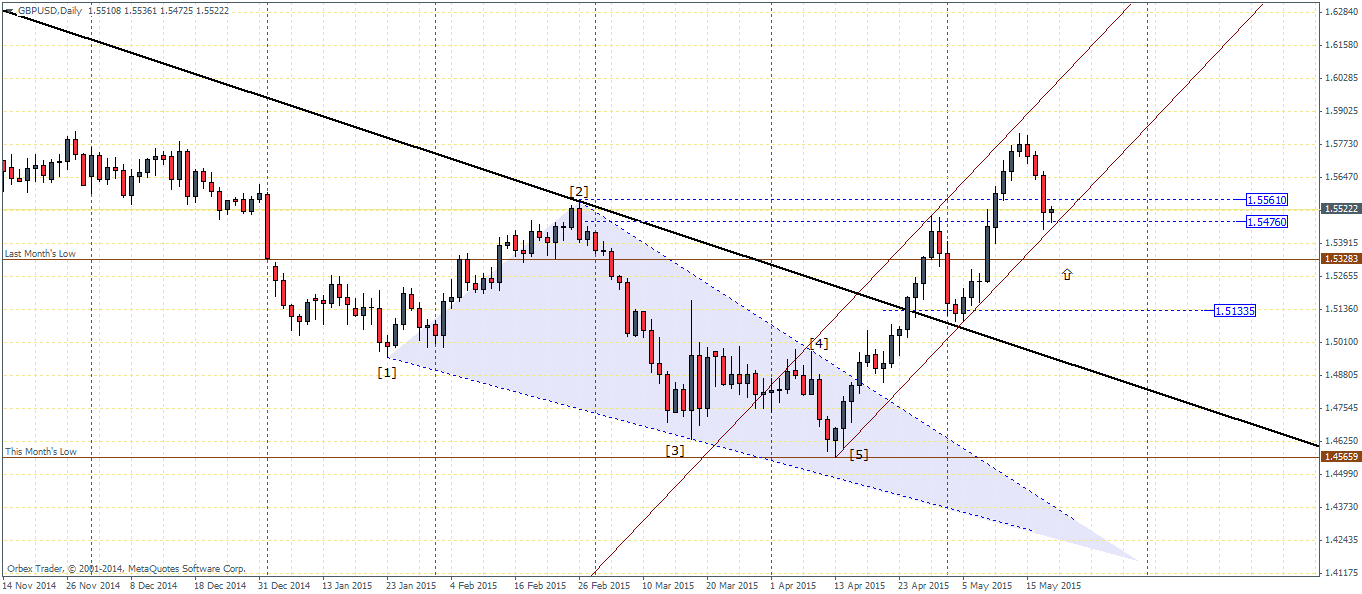
The British Pound did not get much of a boost from the BoE and also remains within the range after losing close to -0.8% yesterday. Price action indicates that the GBPUSD is now back in a familiar support zone and this price level could potentially set the theme for the near term.
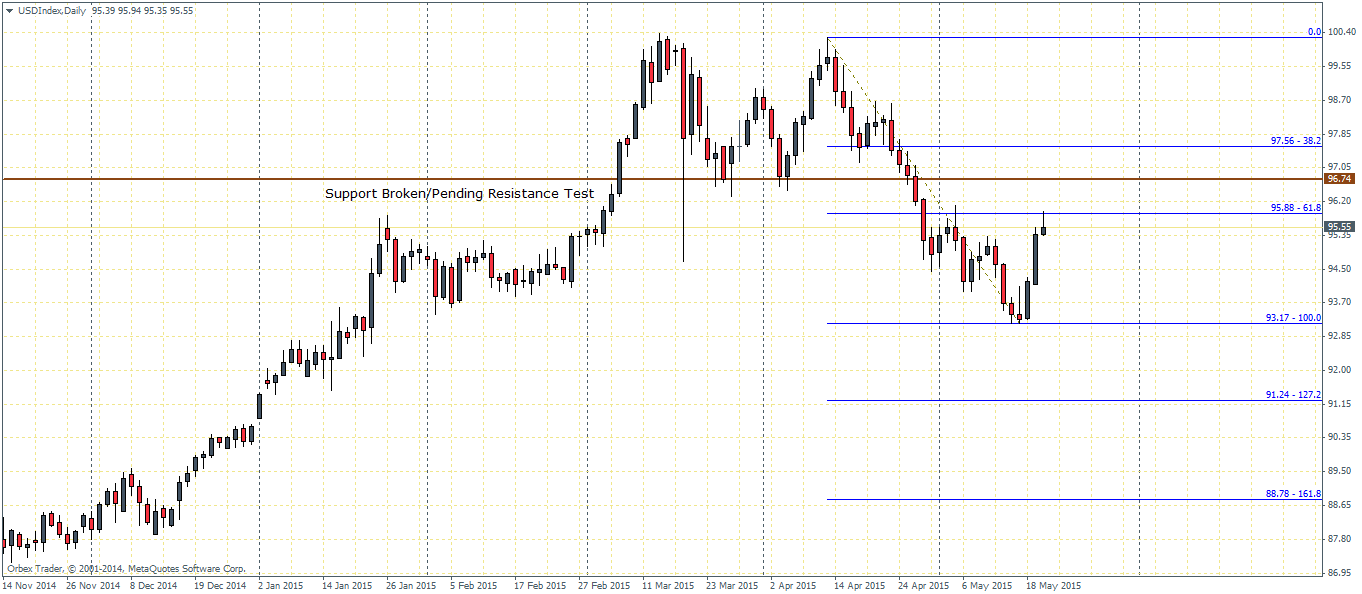
The US Dollar index has managed to turn around yesterday posting one of the strongest single day gains 14th April. However today’s price action is currently flirting near the 61.8% fib level of the recent declines, so the obvious question on everyone’s mind is whether this could mark the end of the retracement or if price could push higher towards the 30.2% Fib level at 97.56. We would prefer to see a daily close above or near the 61.8% Fib level and wait for some kind of bearish candlestick pattern to ascertain our view to the downside. That said, at this point, the Greenback still remains bleak.

After today’s FOMC minutes, the monthly CPI numbers are due tomorrow followed by the all important second revised GDP estimates for the first quarter of 2015, which is touted to show a contraction in the economy. So far, economic data has not been supportive of a rebound in Q2 with the sole exception of yesterday’s housing starts and building permits data. Market participants at this stage are unlikely to shift their bias back to supporting the US Dollar with just one economic data print. In this view, we still expect to see some downside to come in the Greenback.
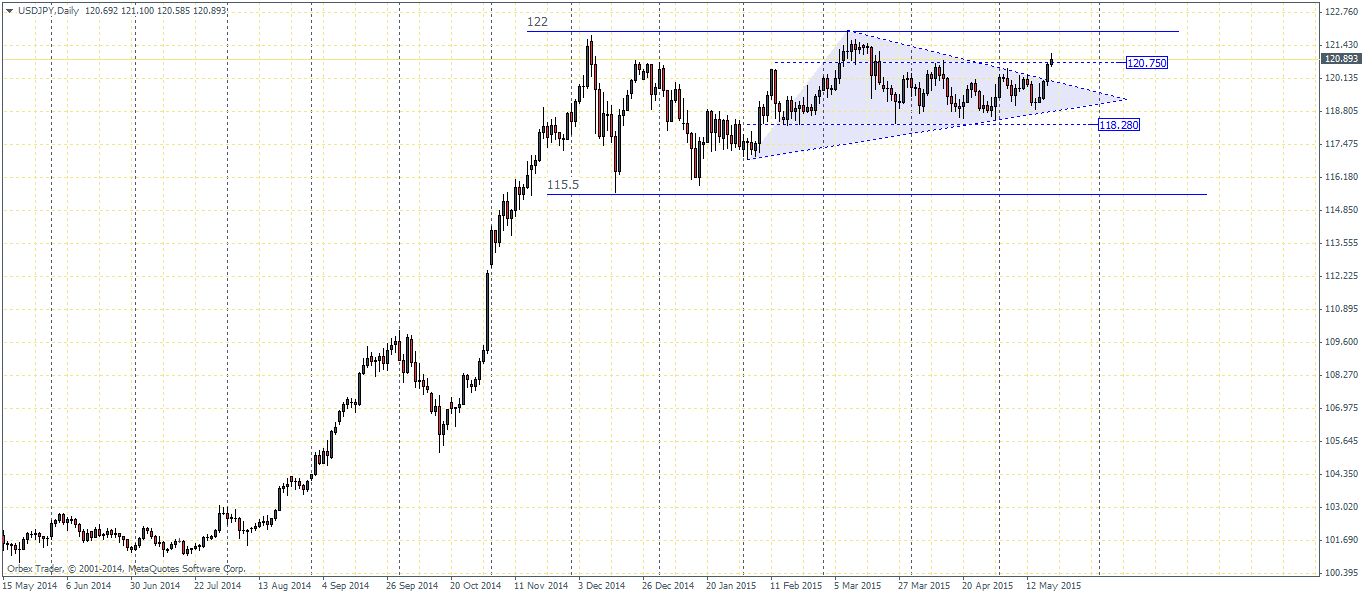
The USDJPY currency pair looks the most interesting and perhaps promising for the USD Bulls. The doji reversal candlestick formed on 14th May and the subsequent bullish closes in price has seen price break out to the upside with price action currently flirting near the upper end of the range at 120.750. USDJPY could potentially turn out to be a buy on dips with the potential to move towards 122/123 price levels in the near term.
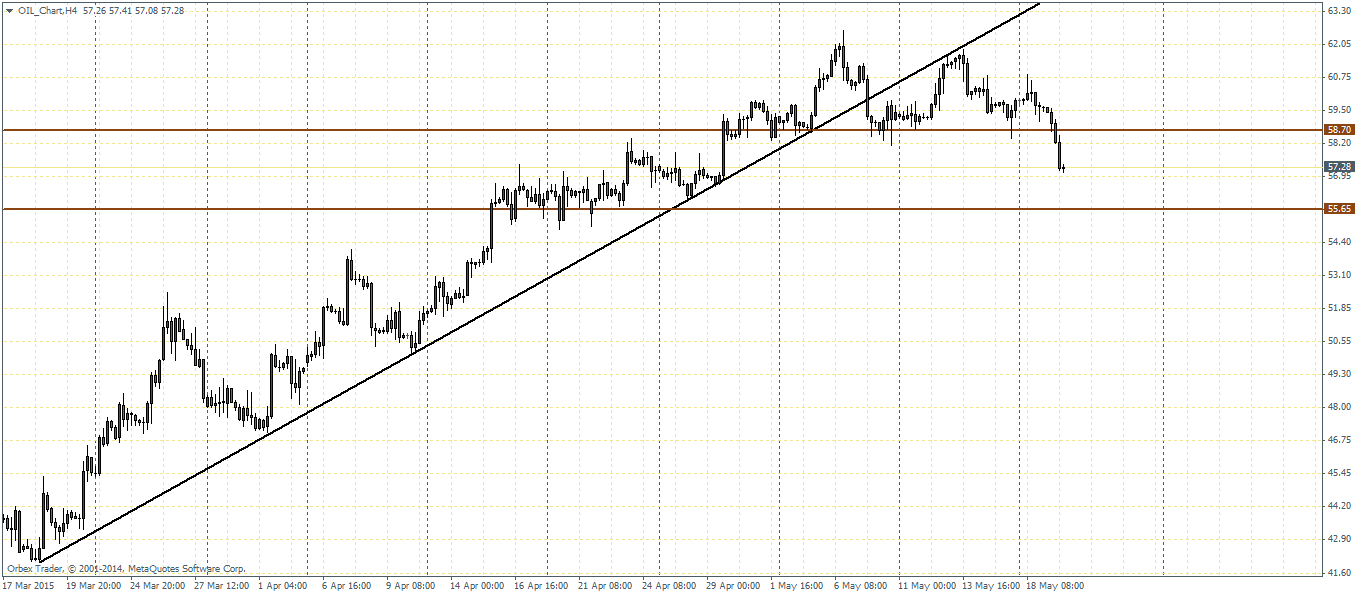
US Oil has been a bit volatile since this morning but the close below 58.70 offers some impetus that we could see a decline down to 55.65. The risk comes from a possible retest towards 58.70, which may or may not happen. That said, Crude Oil remains bullish within the current medium term bullish trend but that could change should we see a close below 55.65 through 55. More detailed analysis presented in our weekly Crude Oil report.

![Credit Card 160×600 [EN]](https://assets.iorbex.com/blog/wp-content/uploads/2023/06/13144507/Blog-Banner_EN-Banner_160X600X2.webp)