
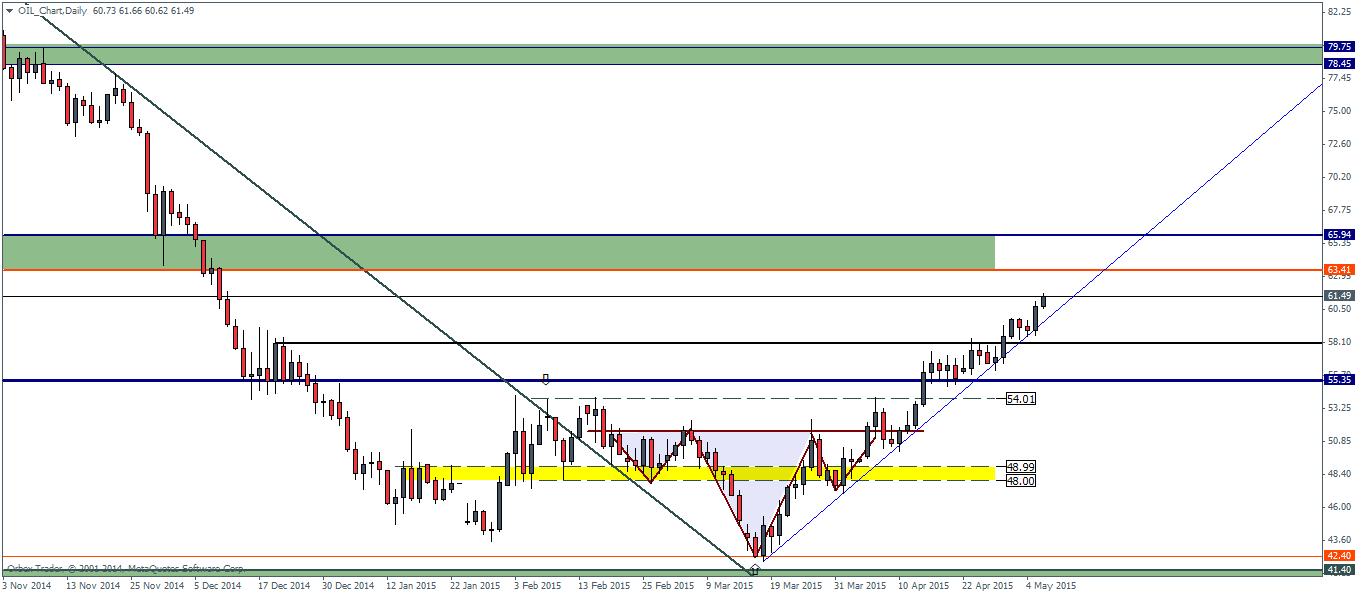
Crude Oil futures look to have established a short to medium term corrective uptrend. Price action has continued to gradually push higher after the formation of the inverted head and shoulders patterns few weeks ago in early March. At the time of writing, WTI Crude Oil is trading at $61.48 and looks poised to test the previous support level that was broken at 66 – 63.5 level for resistance.
This price zone could be important as it could see prices struggle to break through this region. If resistance holds, Crude Oil could see a rather sharp decline back to $58.10 which is where the previously broken minor resistance comes in at and one which could be tested for support. On the other hand, if the price zone near 66 through 63.5 gives way, Crude Oil could push higher towards the next target of 79.75 through 78.45.
Of importance in this short – medium term analysis is the trend line which we have plotted, connecting the inverted head’s trough to the right shoulder. So far, price has been finding dynamic support off this trend line and pushing higher. Therefore, a break of the trend line could potentially offer early clues into a correction to this short to medium term uptrend with the most likely price point coming at 58.10.

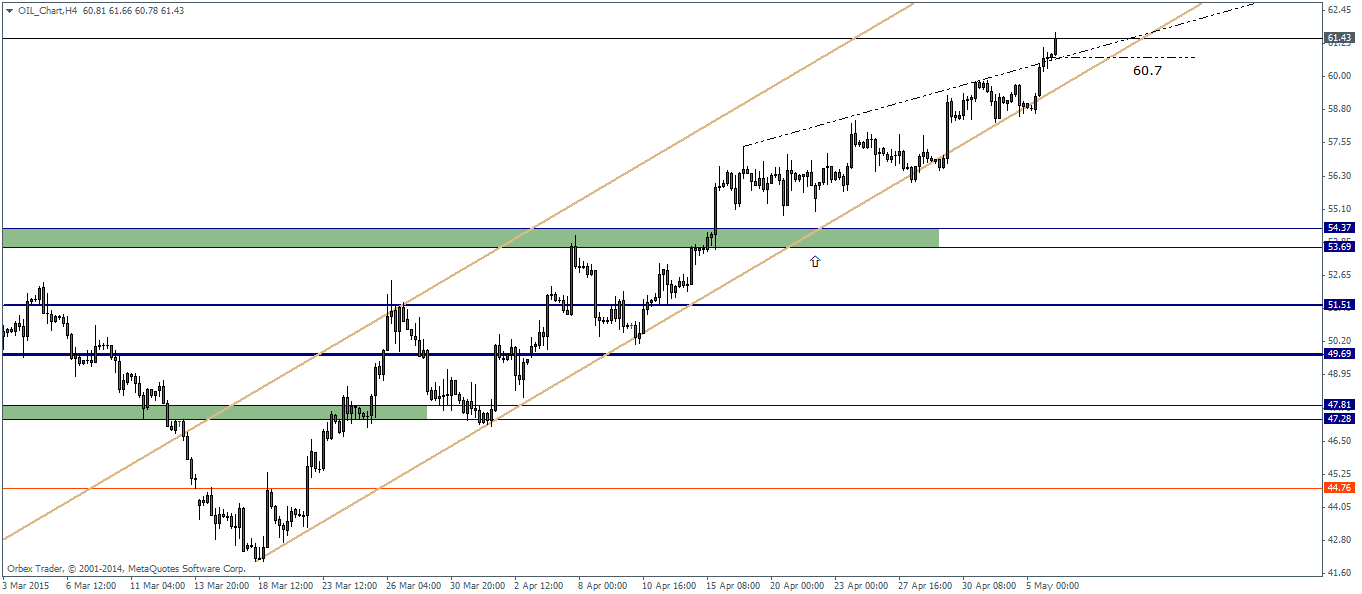
In the 4-hour chart for Crude Oil, we notice that the trend line connecting the highs has been broken near 60.7 as price continues to move within the rising price channel. To the upside, the initial short term resistance comes at 64.4 through 64.5 level which is where we expect price to stall. The price level at 60.7 will be one to watch as a break below this level could turn the view bearish for Crude Oil futures.
Last but not the least, the monthly charts for Crude Oil offers the bigger picture. Here we notice how price saw a clean reversal from lows of 43.65 and managed to break above 54.22. The price region near 54 is something which comes up in all time frames of the charts and we expect that any declines could stall at this level. A break below 54.22 could also be used as a potential warning for the larger bearish trend to resume. However, for now, the upside rally is likely to test the monthly resistance near 74.56 through 71.75 levels, which potentially marks a retracement to the 50% – 61.8% of the previous declines.
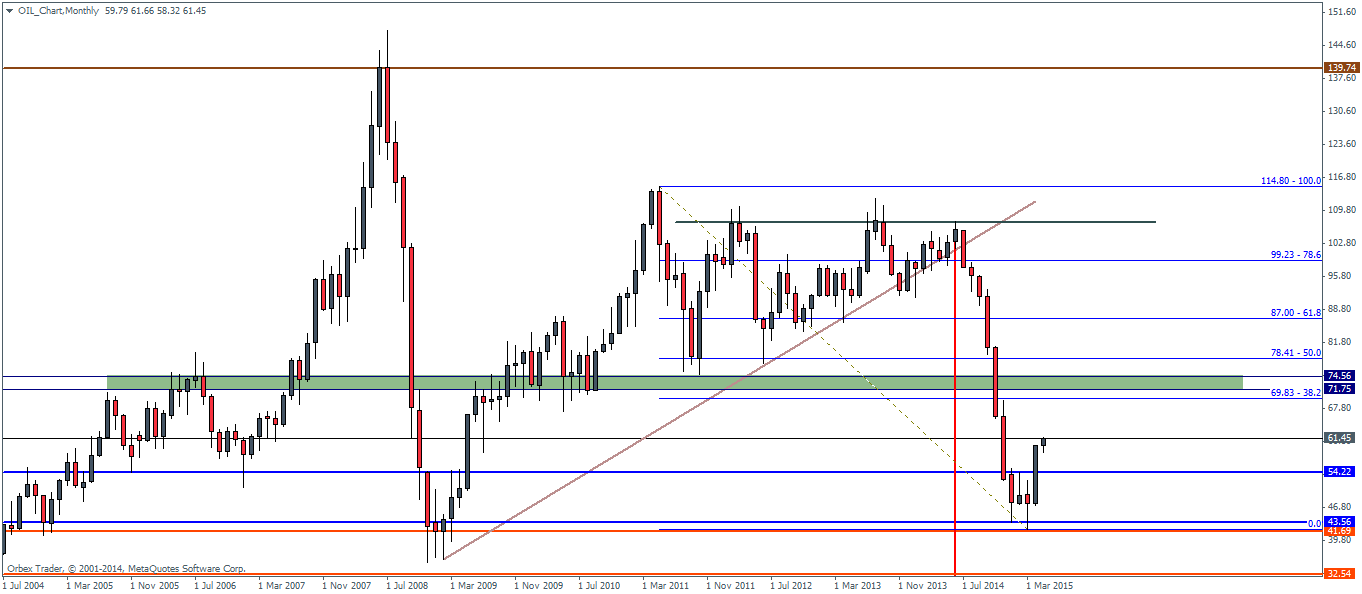
Fundamentally, nothing much has changed as production continues to remain at previous levels. The only factor or variable that has changed is the decline in the Greenback which has managed to fuel the rally in Crude Oil prices. All said and done, keep an eye out on the 74 – 75 price regions in Crude Oil as it could potentially turn out to be the line in the sand.

