
The US Dollar index got many analysts attention over the week, largely due to the double bottom that formed on the 4-hour chart. The big question on everyone’s mind was if the US Dollar would continue its rally or start to fizzle. Yesterday’s retail sales data, although better than the previous month, missed estimates, which saw a sharp selloff in the Greenback. Add to this, other economic data such as the NFIB small business index and business inventories missed estimates as well.
Major institutional banks, taking into account the retail sales data have also lowered their Q1 GDP expectations, which is now near a median range of 1.5%, making a sharp slowdown in the US economy during the first quarter of 2015 (a seasonal trend, and one that is reminiscent of last year).
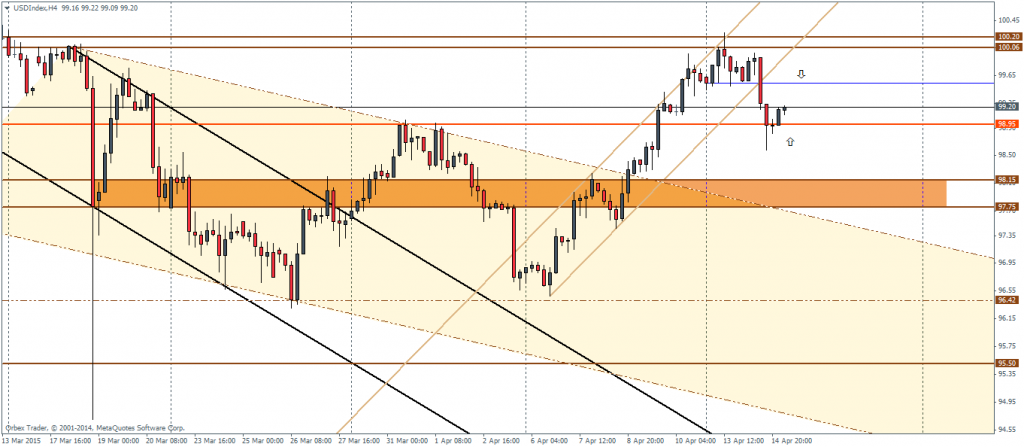
Figure 1: US Dollar Index, Weekly Chart, 08/04

This week, the US Dollar made another attempt to break above the psychological barrier of 100, but failed yet again after briefly spiking to 100.2. The Buck broke down from its rather steep and narrow price channel to find support near 98.95 levels.
The US Dollar is likely to consolidate at this level but price action does give us some early clues to look to.
For starters, we expect a retest towards 99.55 or at the very least, a lower low being made between 99.55 and 98.95. This would give us the first clue of a larger or a steeper correction due. However, should price fall below 98.95, it would question the validity of the double bottom pattern, which gives a rather high upside target, breaking above the 100 price barrier.
In the unlikely event that we get to see a retest to 99.55 and instead witness a straight drop below 98.95, the next support comes at 98.15 and 97.75, which could see the Greenback consolidate and gain some momentum to push to the upside yet again.
And finally, failure to support prices near 98.15 and 97.75 could see a proper correction down to 96.42 levels.
From the weekly charts, we notice last week’s price action printing a very strong bullish engulfing candlestick pattern, which indicates a continuation of the uptrend. Only a break below last week’s low at 96.48 will invalidate this bias and in the longer term point to a decline towards 91.6 levels.
There are a lot more of economic data from the US scheduled this week, with the CPI/inflation numbers due on Friday along with the UoM inflation expectations and consumer sentiment, all of which is likely to bring some risks to the Greenback.
Technically, as long as 98.95 is not breached (or even considering a dip down to 98.15, as an exception), it would still indicate that a move to the upside is the most likely course of action for the US Dollar Index, and a break above 100 would mark a milestone in the Greenback’s rally since mid last year.
For now, the US Dollar index analysis shows a break above the previous low at 99.5 levels in order to ascertain its bullish momentum. Failure to do so will give a clear indication of a dip down to 98.15.

