
There are no doubts about the fact that the US Dollar Index has slowed down in its bullish momentum ever since the March FOMC monetary policy meeting. The most recent jobs data for the month of March, which showed a disappointing pace of job creation along with a downward revision of close to 69k of the previous two months added to concerns weighing down on the Greenback.
From a longer term perspective, the currency declines offer a much needed correction to the uptrend considering the sharp rally in the Dollar Index. The Greenback has hit a roadblock after testing the psychological level of 100 and looks poised for a much needed correction in order to establish support before resuming its uptrend. As such, the weekly chart points to potential support levels that could tested at 94.8 through 92.8 price zone. Establishing support at this level could help the Dollar index to possibly break above the psychological barrier of 100 in the longer term, as show in the weekly charts.
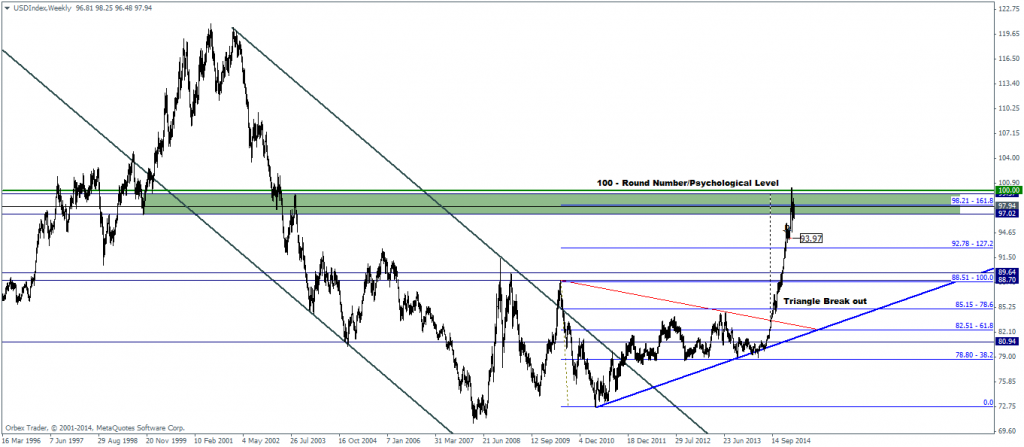
Figure 1: US Dollar Index analysis, Weekly Chart, 08/04

Switching to the more short term outlook, the US Dollar index currently points to a potential decline towards the first short term support at 96.5 followed by 95.5 levels.
The 4-hour chart below shows price trading within the falling price channel, marked since mid-March. Although price seems to have broken out from the first price channel, the price action is fully contained with the second evolving price channel. Both of these price channels point to the fact that the Dollar index could see a test to 96.42 levels, which is narrowly missed earlier this week.
The fact that price saw a reversal from close to testing this level is indicative that we could see a further test below to 95.5 levels in the near term should the first support level give way.
Alternatively, for a bullish view, the Dollar index will have to break above the second falling price channel and possibly dip back to retest the break out level near the 97.8 price point. This could then see the Greenback test its rally towards 98.95 and eventually another attempt at breaking the 100 level.
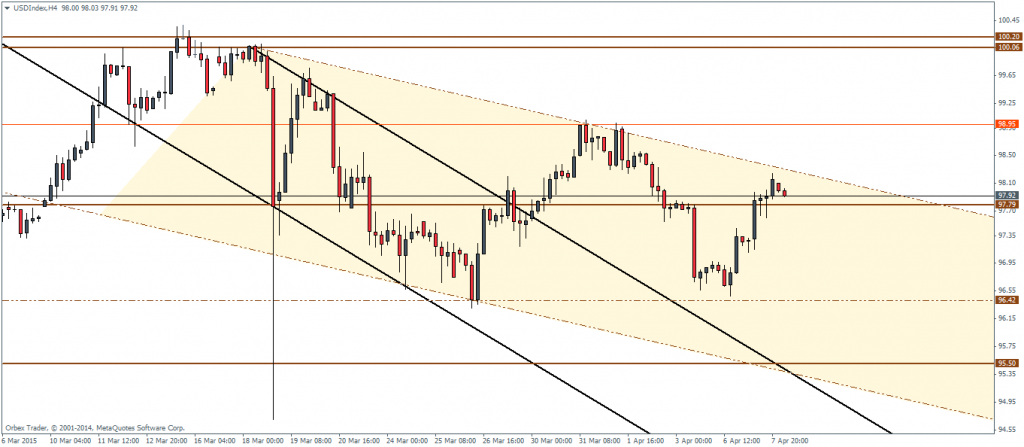
Figure 2: US Dollar Index Analysis, H4 Chart, 08/04
Further supportive of the fact that a decline in the US Dollar Index is in store is by applying the Median line analysis. In this aspect, we notice that in the first instance, price failed to continue its rally towards the median line, which is indicative that a change of sentiment is taking place. As expected, the Dollar index declined towards the lower median line before breaking out from it. The current retracement shows a lower high being formed in what could be a retest of the median line break out before pushing lower towards the first target towards 96.33 followed by a decline to 94.10. However, a break above 99 will see the Dollar index soar towards 99.96 level, but it would still look bearish for the Dollar with steeper declines in store. This could potentially see a recovery in most of the currency pairs such as the Euro, British Pound and even the commodity risk currencies such as the Australia, Kiwi and Canadian Dollars.
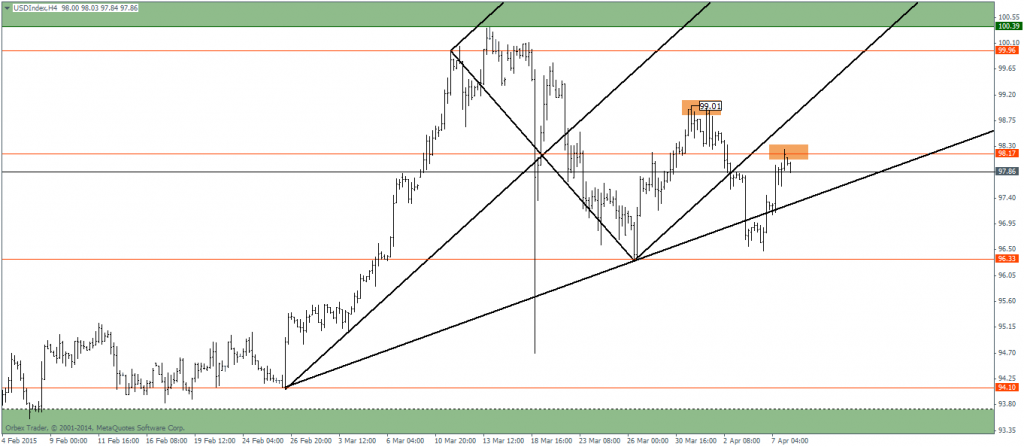
Figure 3: US Dollar Index H4 Chart - Median Line Analysis

