
Prices of the precious metal, Gold saw a sideways pattern start to take shape after a high at 1224.3 was made three weeks ago around the week of 5th of April and since then, prices of Gold have been hovering between the highs at 1224 and 1184.13 lows. At the time of writing, Gold is looking to test the lower end of the range, with price nearing 1192.02.
The weekly charts for Gold shows this sideways price action forming near the major support level between 1202 through 1150.13 levels. In this regards, within the larger time frame, unless price makes a clear and a decisive break below 1150, or above 1224, we can expect the sideways price action to persist.
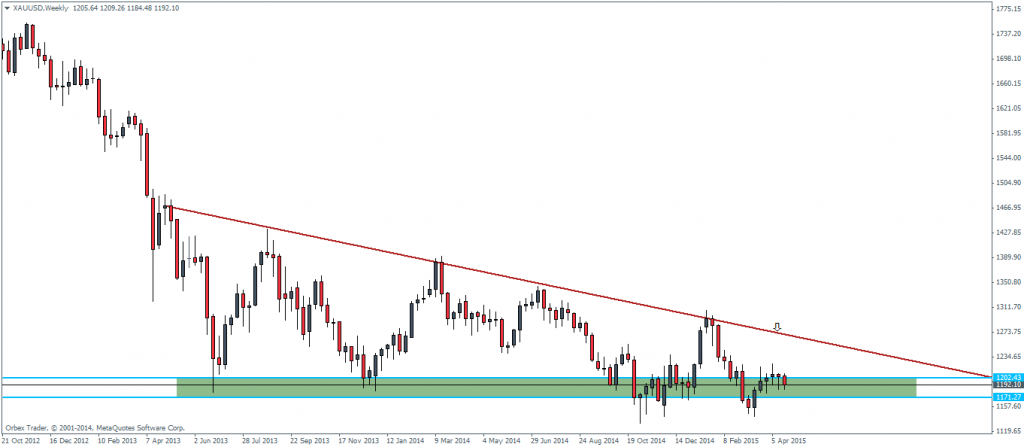
Weekly Gold Futures Chart – 24/04

In the daily charts, we notice a possible bearish flag being formed right near the medium term support level of 1203 – 1197. The sharp sideways movement here indicates a possible break out that could come soon. The bearish flag puts the bias to the downside with the potential of testing the next support near 1141 region. However, yesterday’s candlestick looks to have closed with a piercing line pattern, which is indicative of a possible move to the upside. But given the proximity to the support, we could perhaps expect to see another day of ranging price action with no clear outcome in the medium term.
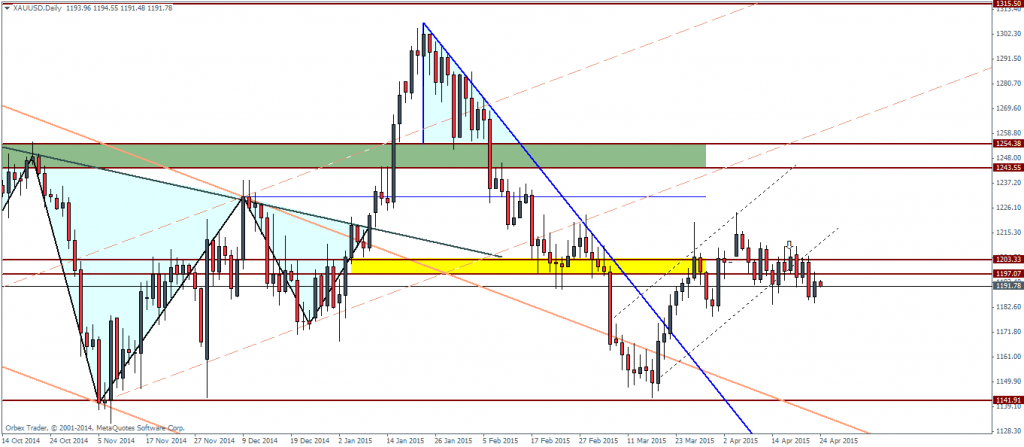
Gold, Daily Charts – 24/04
Finally, the 4-hour chart, which gives a more short term view of price action looks to be trading close to the very short term support/resistance level of 1194.14 and the major longer term support resistance near 1187 through 1183 followed by another level near 1180 – 1179 which forms the previous break out level from the falling price channel.
The H4 chart therefore gives us some levels to watch for, which is namely, an upside bias should price break out from the falling price channel and close above 1194 and a downside bias if the levels below 1179 is cleared.
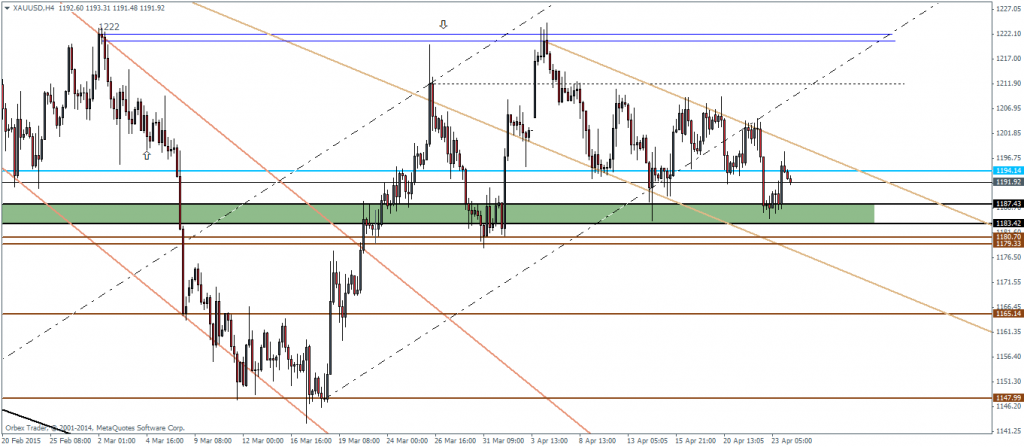
Gold, H4 Charts – 24/04
Silver – Technical Analysis
For Silver futures, we come back to the major head and shoulders pattern that looks to be shaping up very nicely after the right shoulder was formed near 17.09 through 16.81. The right shoulder however is not yet completed, as we need to see a test down to 15.52 – 15.32.
A test to the neckline will see the head and shoulders pattern completed and we could anticipate a move to the downside.
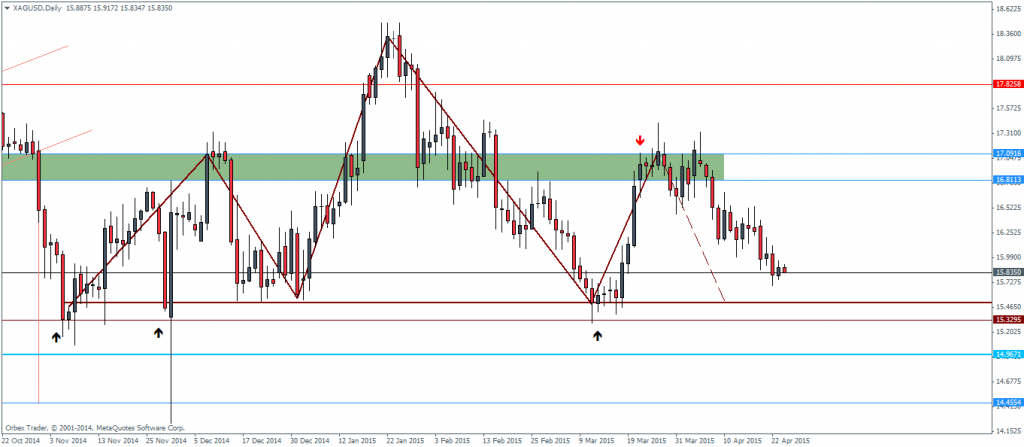
Silver, Daily Chart, 24/04
The dip to 15.5 levels looks imminent as the 4-hour chart shows the break out from the descending triangle pattern noted, which points us to the minimum targeted measured move to 15.56 which validates our move.
The only potential risk to bear in mind is the possibility of a double bottom that could form if prices stall or see a sharp reversal near the region of 15.56 through 15.42.
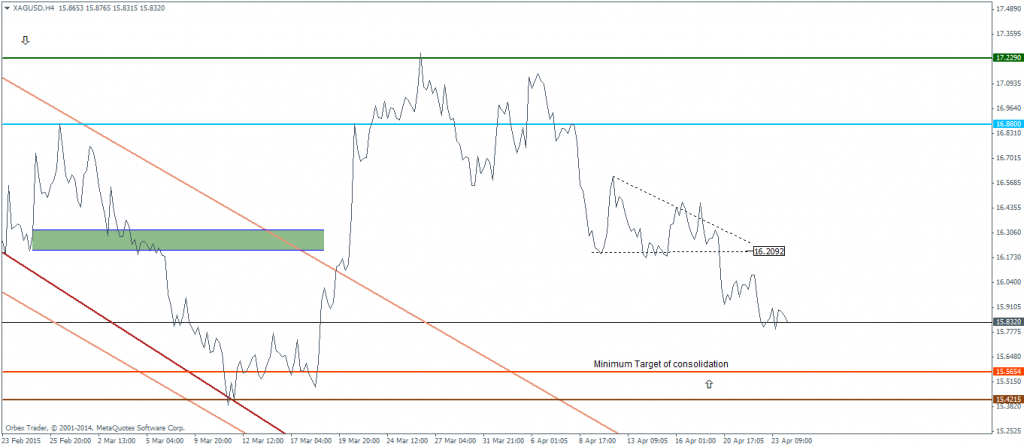
Silver, 4-hour Chart – 24/04
For the moment however, Silver prices look firmly strong in its downtrend and until we see a decline down to 15.56 levels, we can expect Silver to be good sell the rallies candidate. The bias will however have to be revisited once price closes near the 15.56 region.

![Credit Card 160×600 [EN]](https://assets.iorbex.com/blog/wp-content/uploads/2023/06/13144507/Blog-Banner_EN-Banner_160X600X2.webp)