Below is the Gold and Silver update technical analysis for Friday, the 10th April:
Is Gold back to resuming its bearish trend?
After briefly spiking to 1222 as noted in our previous weekly analysis for Gold, Gold futures promptly declined lower breaking out from the rising price channel on the 4-hour charts. Currently, price action looks to be retracing the break out level near 1200 region before the bearish trend will see Gold possibly test the support at 1187 through 1183. A break of this support could see the precious metal potentially decline lower towards the next support levels at 1165 or 1147. However, in the event that the support at 1187 hold, price action could make another attempt to push higher, however this scenario looks a bit difficult at the moment.
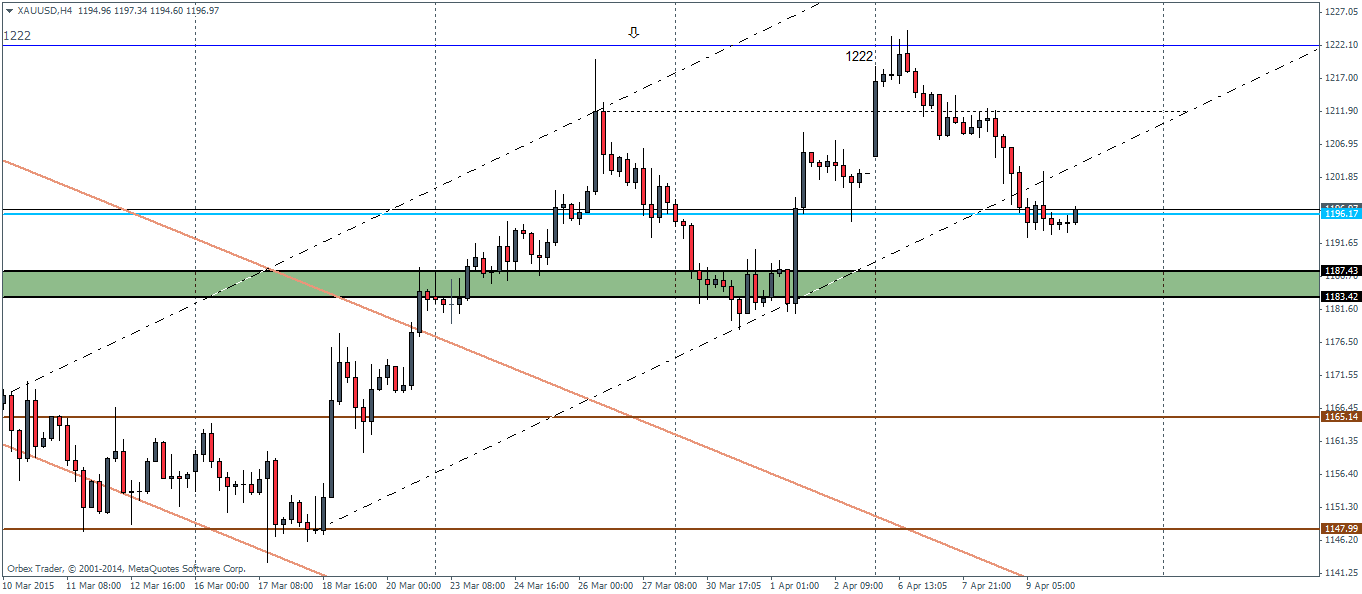

Figure 1: Gold Futures, H4 Chart, 10/04
From the weekly chart, Gold futures are looking increasingly possible to close this week on a bearish note. Therefore, today’s price action will be critical to see how the weekly candlestick closes. If price action results in a doji type of a candlestick, the fact that this comes at a major long term support/resistance level could indicate that investors are unsure if to remain long or short on Gold and could balance the scales equally. However, a bearish close on the weekly charts could spell further declines in the store pointing to an initial decline to 1171 and eventually give way for more declines in the medium term.
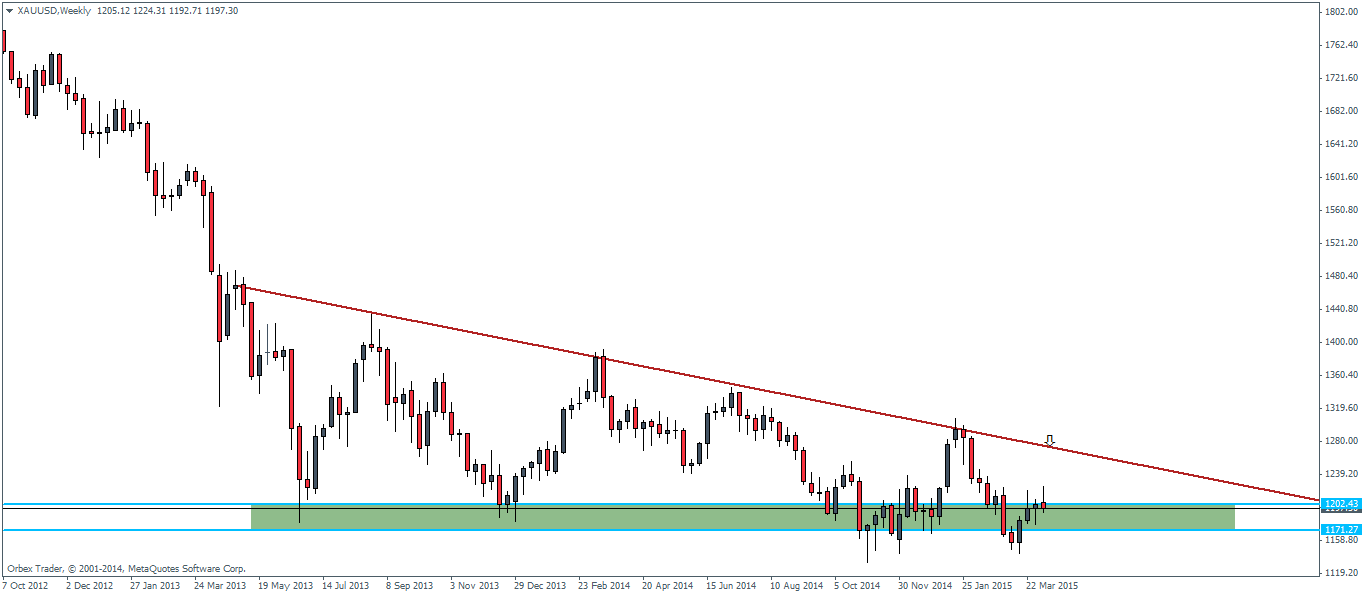
Figure 2: Gold Futures, Weekly Chart, 10/04
The weekly charts could then potentially point towards the bigger picture, where in the monthly charts, we notice Gold currently at the major support/resistance level at 1198 – 1200. A close below with a failed attempt could see Gold prices fall to 1082 in the longer term.
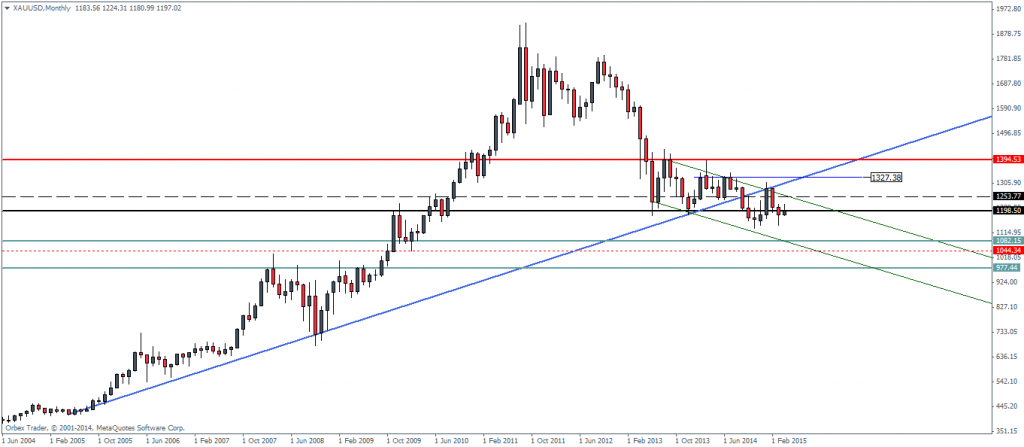
Figure 3: Gold Futures, Monthly Chart, 10/04
Silver – Forms the right shoulder
Silver prices reversed their gains near 17.091 and as pointed out in our last week’s report about the possible head and shoulders pattern taking shape, it seems that the right shoulder is now in place. However, until price completes the leg down to 15.5, we will have to wait before confirming a head and shoulders pattern on the daily charts.
In the event the pattern is completed, Silver futures have a very bearish outlook, with the potential of targeting a minimum price objective to $13.91.
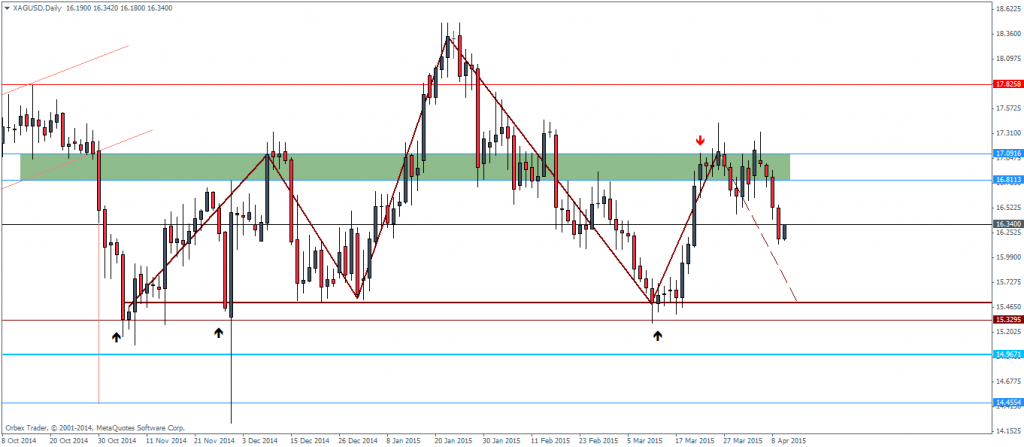
Figure 4: Silver Futures Daily Chart, 10/04
Looking to the weekly chart time frame, it is starting to look very clear that price has failed to rally above 16.84 levels. If we see this week’s candlestick close bearish it would give the first confirmation that Silver futures on the daily charts would be poised to move lower to the neckline to complete the right shoulder.
However, the weekly charts also point to a minor dynamic support via the trend line of the falling price channel, which could offer some kind of short term resistance. A break below this trend line will see Silver head back into the falling price channel and could look towards testing the previous lows of 14.59.
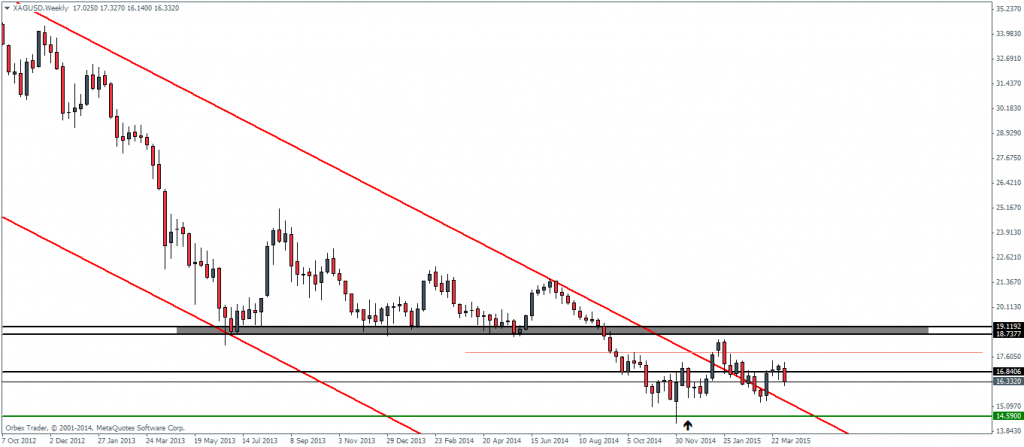
Figure 5: Silver Futures, Weekly Chart, 10/04

