Gold and silver update for 3rd April features the following:
Gold poised to test $1222
Gold futures saw a bullish week in what seems to be a continuation of gains from the previous metal for the third week in a row, after reversing from lows of 1142.92. The weekly charts confirm that the bullish engulfing pattern witnessed three weeks ago is valid but the risks to the longer term bullish sentiment comes from the fact that the levels of 1202 through 1171 remains a major support/resistance level of the descending triangle pattern. Within the weekly charts, the upside moves in Gold could well be contained by the trend line shown on the weekly charts below.
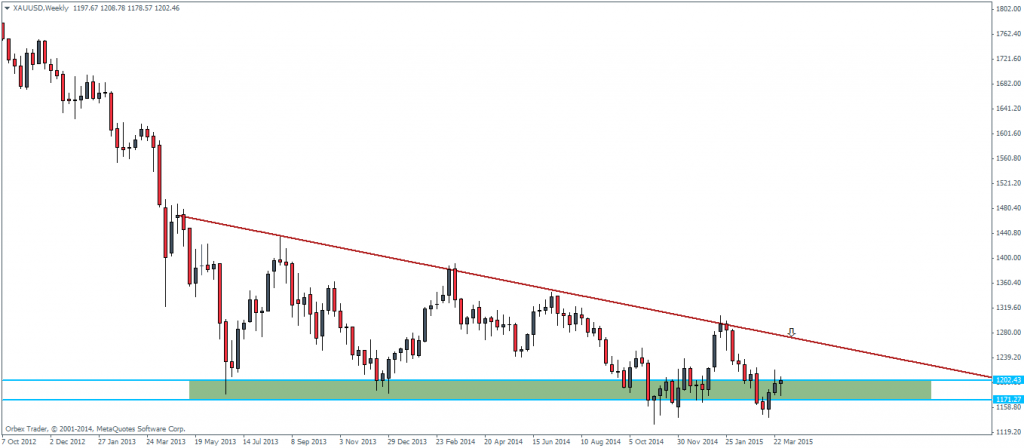

Figure 1: Gold Futures, Weekly Chart, 03/04
Looking to the daily charts, Gold is currently back near a major support/resistance level of 1203 with this level previously pushing prices lower. However, Gold futures managed to find support at the breakout of the trend line which followed a very strong bullish candlestick pattern. A break above 1203 will confirm a move to the upside targeting 1222 and further higher to 1243. The daily charts, as shown below however does signal the risk of prices being pushed down at the resistance level, which could then see Gold plummet lower to 1141 levels.
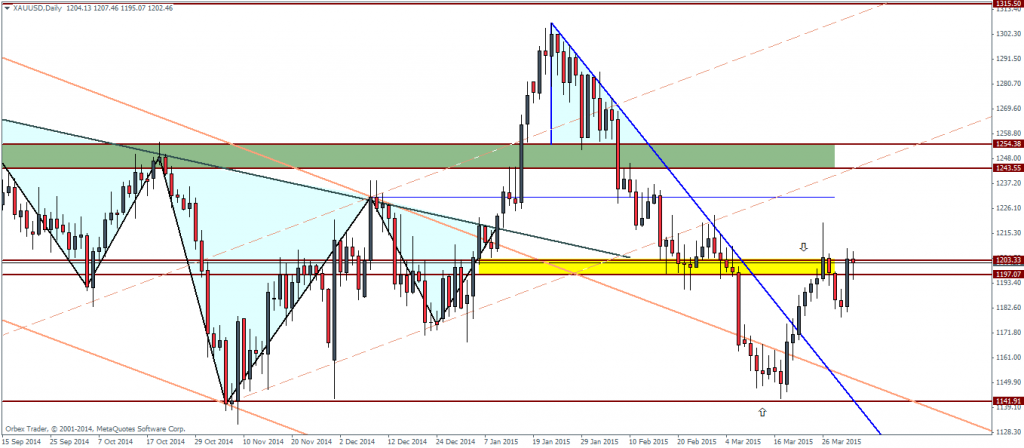
Figure 2: Gold Futures, Daily Chart, 03/04
Finally, the 4-hour chart in Gold shows price action trading within the rising price channel with the support at 1196 being tested briefly. We can expect a decline to this level before price breaks higher to 1222 levels. The breakout from the price channel to the downside looks a bit tough considering the major support level that sits at 1187 and 1183 levels.
To conclude, the overall picture for Gold remains biased to the upside with the potential to test 1222 and 1243 levels but a failure to rise above 1200 on a strong candlestick could indicate either a ranging price action or a potential decline to the downside back to 1141.
Silver – Head and Shoulder?
Silver futures in contrast to Gold has barely moved for the past two weeks, as the weekly charts below indicate a doji/indecision candlestick formed at the support/resistance level of 16.84. Price action could break out in either direction, with the aim to test 18.7 to the upside and 14.5 to the downside.
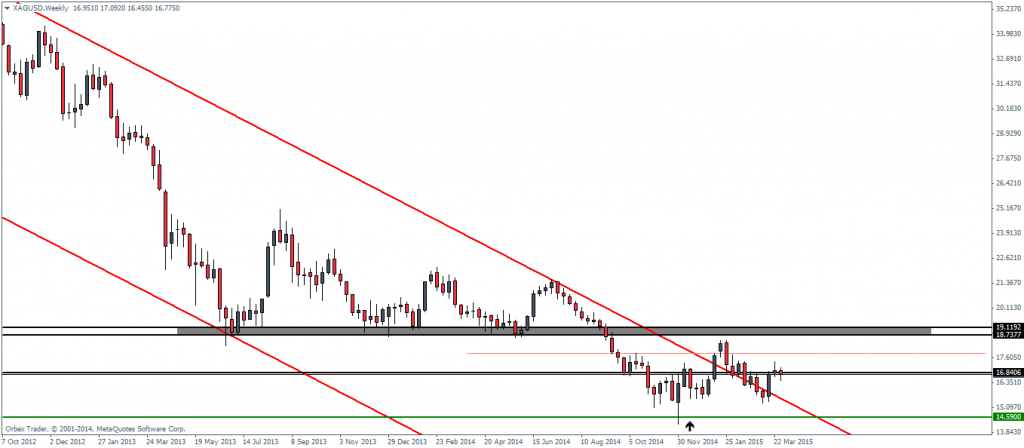
Figure 4: Silver Futures Weekly Chart, 03/04
Moving to the daily charts, Silver futures have moved back to test the previous support/resistance level at 17.09 – 16.81. It is therefore not surprising to see why price was indecisive from the weekly charts above. An interesting discovery to point out to is that within the daily charts, Silver futures look to be forming a head and shoulders pattern as shown in the chart below. This H&S pattern if valid could see prices decline to as low as $13. However, the H&S pattern is not yet complete as we need to see a completion of the right shoulder and this could very well be invalidated should prices break above 17.09.
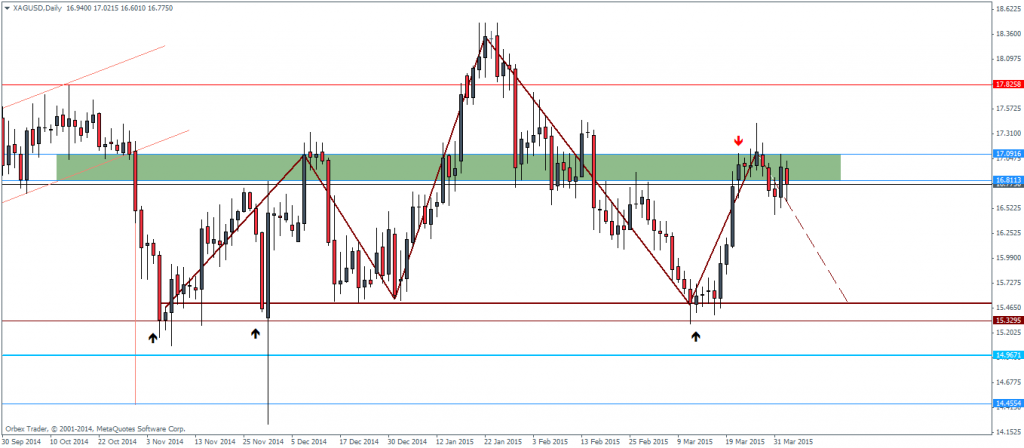
Figure 5: Silver Futures, Daily Chart, 03/04
To conclude, Silver futures could turn out to be tricky in the near term, with the weekly chart aptly showing the indecision among traders. However, keep an eye out on the Silver daily chart for a validation of the head and shoulders pattern, which could turn out to be quite bearish in the medium term.

![Credit Card 160×600 [EN]](https://assets.iorbex.com/blog/wp-content/uploads/2023/06/13144507/Blog-Banner_EN-Banner_160X600X2.webp)