Gold & Silver Update
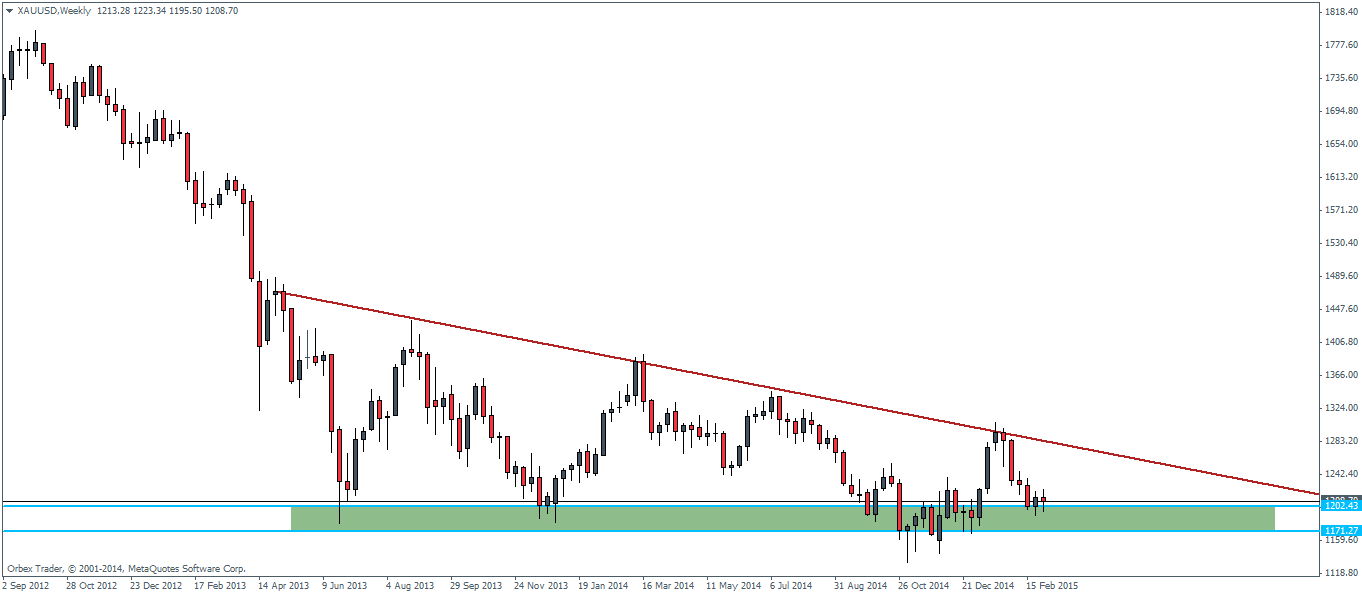
Gold attempting a rally from $1200
Gold futures have been stuck in a range trading close to the 1200 and 1197 handle as noted in our last week’s analysis. From a weekly perspective, Gold futures managed to post a small bullish candlestick on the weekly charts near the major support level indicating a possible upside shift in bias in the short term. This view would be further validated on a weekly bullish close, but major risks remain to Gold futures, especially this Friday’s US Jobs report, which could tilt the scales in either direction.
The weekly charts, shown below give the context of our analysis. Price action is looking to yet again bounce off a major support level between 1200 and 1171 price zone. But the bounces are likely to remain limited to 1280 level at the maximum.

Switching to the daily charts, we notice the short term price action. With prices looking to lift off from the 1200 mark, the first price zone for Gold to react to comes in at 1231 level. A break above this level will see a test to 1243 – 1250 levels which form a major resistance level. However, it is unlikely to expect price action to break to the 1250 level, given the current conditions.
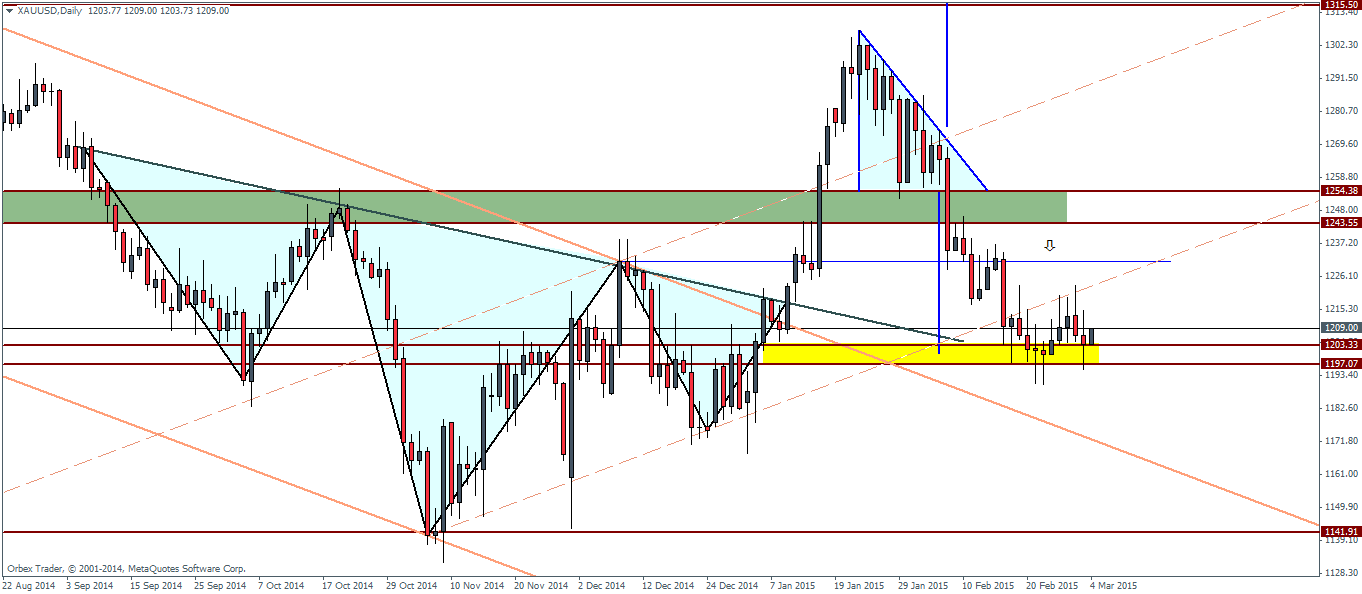
The 4-hour charts probably give the final pieces to the clue as we plot a new falling price channel. Here support is identified at 1200 while resistance comes in at 1230. We can, therefore, expect a retest down to 1200 to test the support for the possibility of a move higher towards 12230 levels within the short term time frame. Of course, price will have to break out from the price channel and is likely to react to the short term resistance at 1222.07.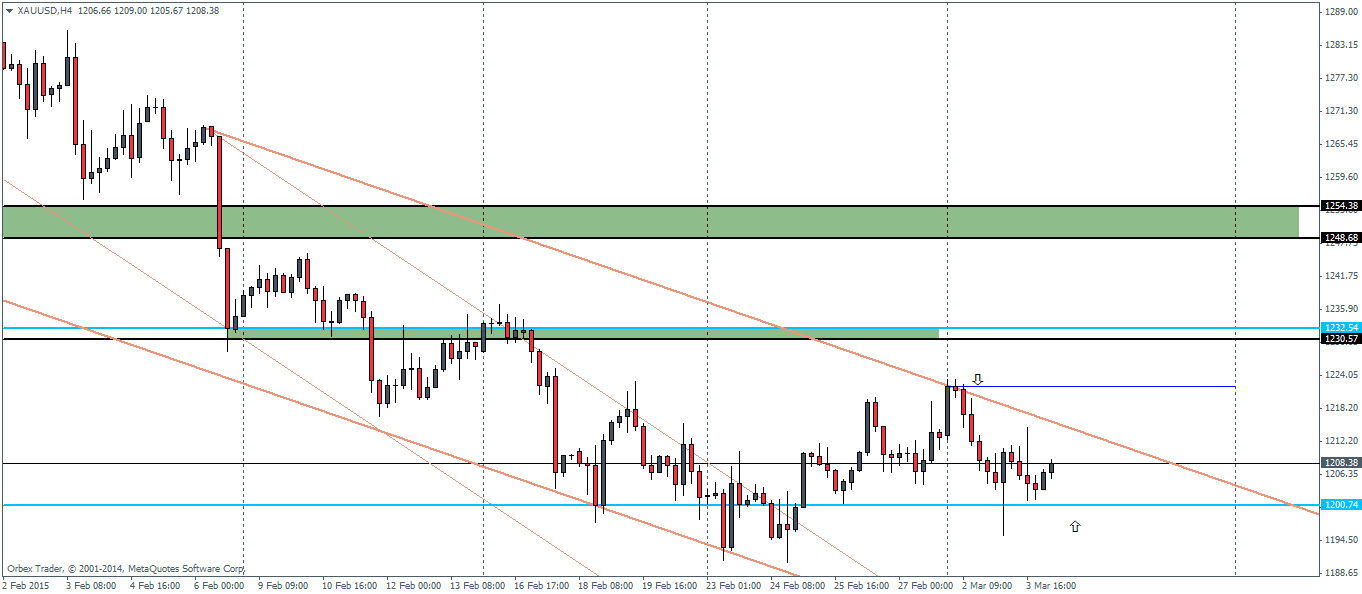
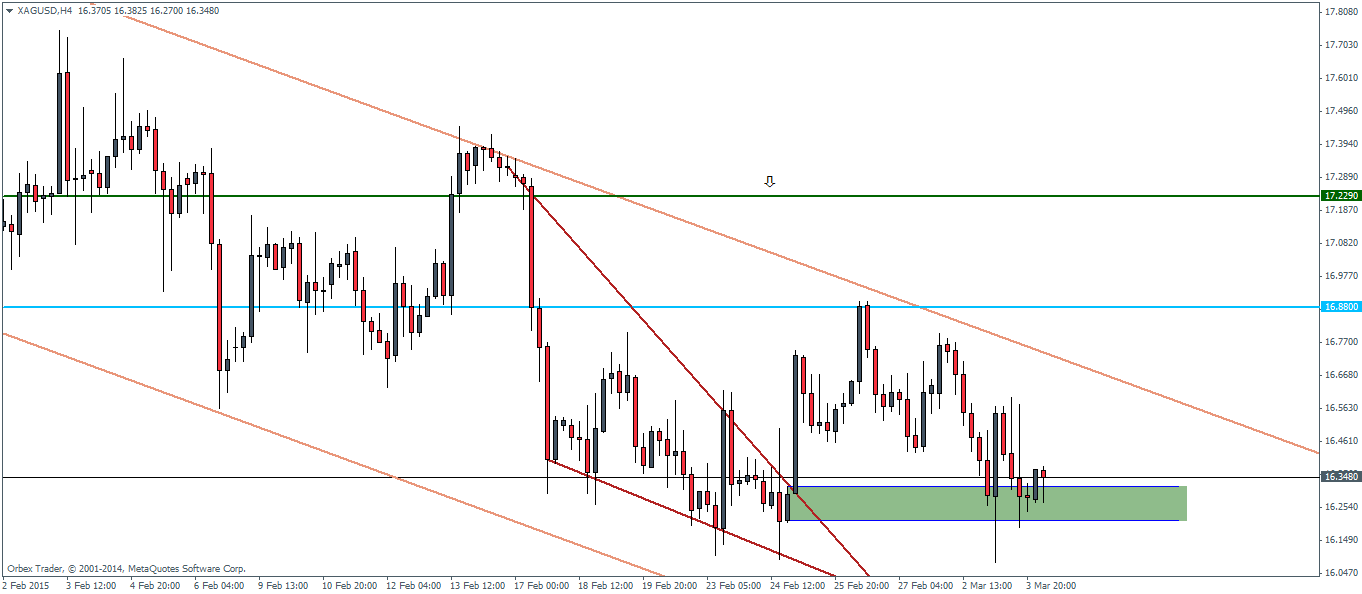
Silver, close to testing 16.8 resistance level
Silver futures from the daily charts have not moved much and yesterday also closed on a bearish note. We expect the choppy price action to continue before the direction is established. At best, stay aside from Silver until resistance is established near 16.8 through 17 resistance zone. This retest would qualify the descending triangle pattern which gives a downside objective to 15.33 followed by 15.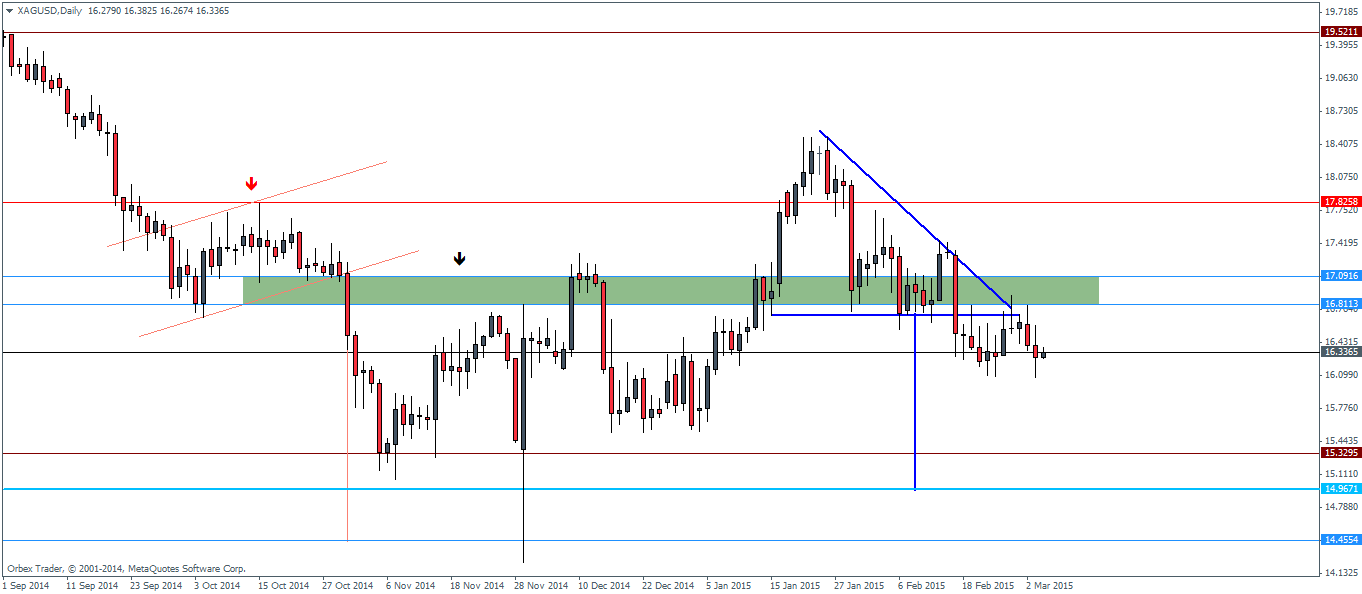
From the 4-hour charts, we notice that after the falling wedge/triangle pattern was formed within the larger falling price channel, price rallied to 16.88 and fell back. The decline, however, looks to have stalled near the previous breakout level at 16.25 through 16.15 levels. If this support holds, Silver futures could attempt another rally to the upside. However, the price channel will have to be broken for aiming for upside gains.
Alternatively, if Silver fails to break above the previous higher close, we can expect the bullish momentum to fade and a breakdown from 16.25 – 16.15 level would pave the way for further declines.