
We started the week asking the question whether the US Dollar would resume its bullish momentum after a weaker the week before followed by a directionless price action last week. With still a good couple of hours to go that could shift the momentum in either direction, the longer term charts of the US Dollar Index is starting to point to what is evidently a start of the correction.
Taking a quick glance other major currency pairs such as the EURUSD, GBPUSD or even the weaker Aussie dollar, we do notice that most of these currencies have started to gain against the Greenback despite their fundamental weaknesses and dovish monetary policies. But in order for the Dollar Index to continue to rally, it must at some point look to a correction in a bid to form a support level that could push it higher.
There were two main points from our previous article from a technical perspective, which was the “Hanging Man” and a “Doji” candlestick that were formed over the last two weeks. Price action at this point in time is currently looking to a very bearish weekly close as seen in the chart below.
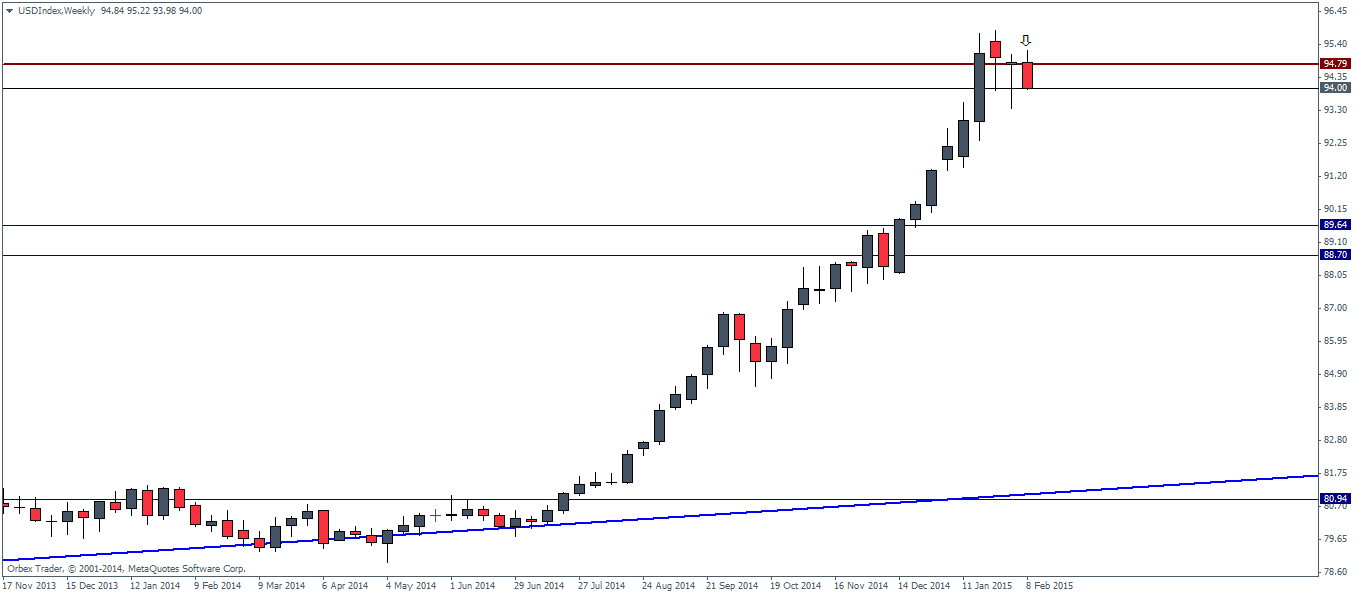

Should we see a close below the Doji’s low at 93.39, it would be a confirmed price action that the Greenback is heading for some short term weakness. There are no major market moving events scheduled for today and if the current trend continues, we could either expect to see a bearish candlestick or at the very least another Doji formation.
The daily charts for the Dollar Index chart show early clues to what is happening on the daily basis. Here we notice the consolidation triangle being formed at the top, indicating a breakout to either direction. While price action initially shot to the upside, it is now evident that it was a fake move as identified by the shooting star candlestick pattern formed right near the breakout high followed by a bearish candlestick close yesterday. Today’s price action is also showing a close below the short term support level within the triangle inferring that the bearish momentum is likely to pick up. But for a clear confirmation, we would have to see a very bearish close below the lows of the inside bar pattern at 93.39 (which is the low of the Doji from the weekly)
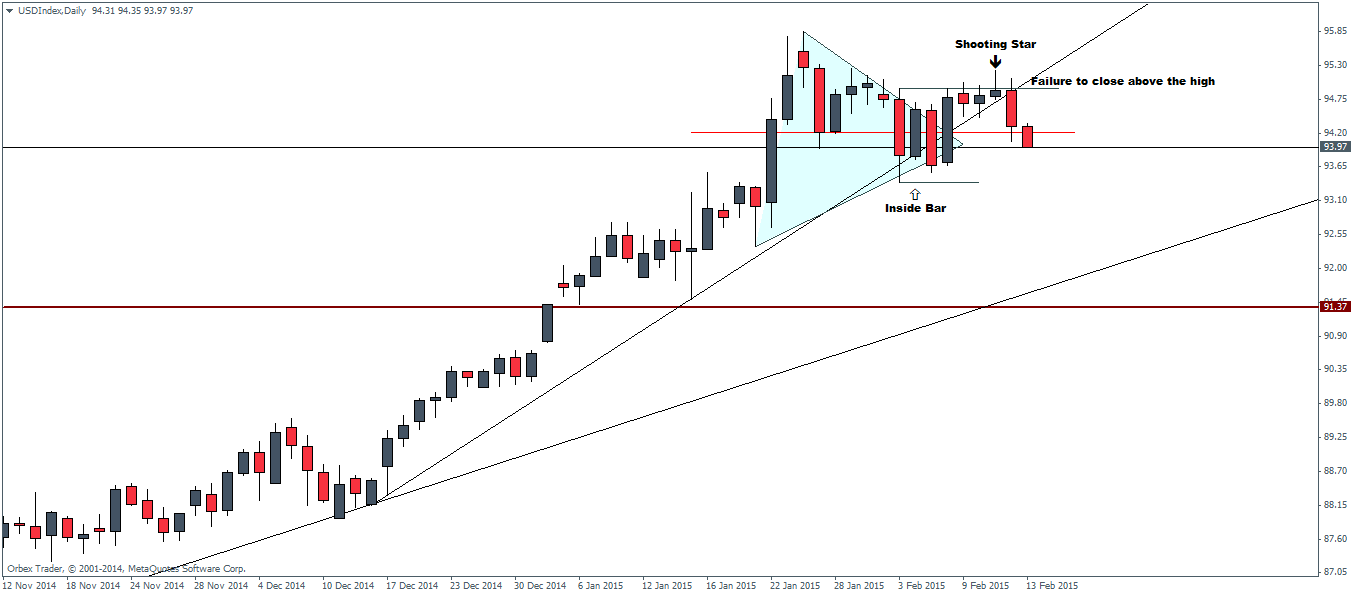
The obvious question that comes to mind is where the next support lies if the above bearish analysis is true. For that, we do have the second trend line which could act as a dynamic support while a major horizontal support level comes in at 91.37 and an unfilled gap near 90.62, making the whole region between 91.37 and 90.62 as the most ideal support level that the Dollar Index could target in this correction.
Today’s economic events include the UoM inflation and consumer expectations which although can be volatile are nothing major to look forward to. Next week, on the 18th of February, the Fed will be releasing its FOMC meeting minutes which is when we could see further insights into how the Dollar Index is going to behave. For now, it would be a good time to revisit your USD longs and book profits where required.

![Credit Card 160×600 [EN]](https://assets.iorbex.com/blog/wp-content/uploads/2023/06/13144507/Blog-Banner_EN-Banner_160X600X2.webp)