
Is Gold resuming its downtrend?
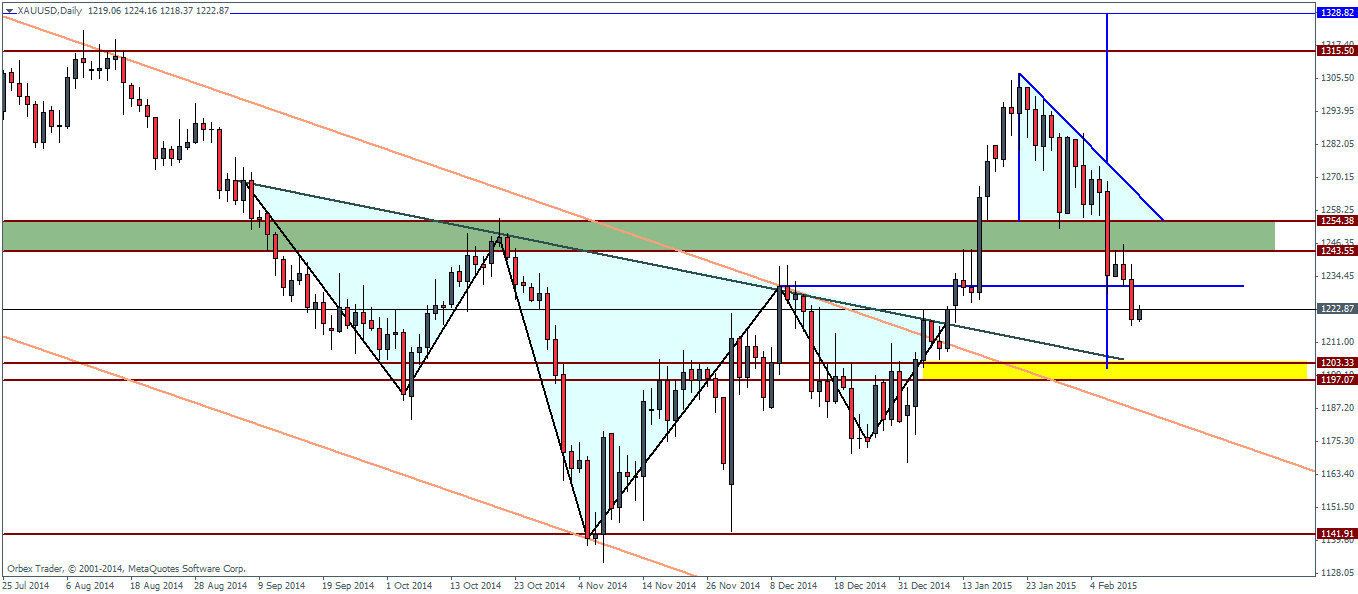
Gold futures failed to hold on to their bullish momentum, reversing its gains from highs of 1300 levels. Failure to support prices near 1250 levels saw Gold futures decline below the 1250 handle currently trading near 1222.
The bearish turnaround in Gold however is as expected; based on our weekly Gold technical analysis as pointed out last week. The current declines give a downside target back to the 1200 levels, which technically makes for a retest of the inverted head and shoulders pattern.
Should prices manage to hold at this support between 1200 – 1197, we could expect to see another attempt to rally, with the first resistance at 1250 which needs to be broken. Failure to rise above 1250 could confirm the turnaround in Gold for the near term, with a possible test lower to 1140 as show in the daily charts for Gold.

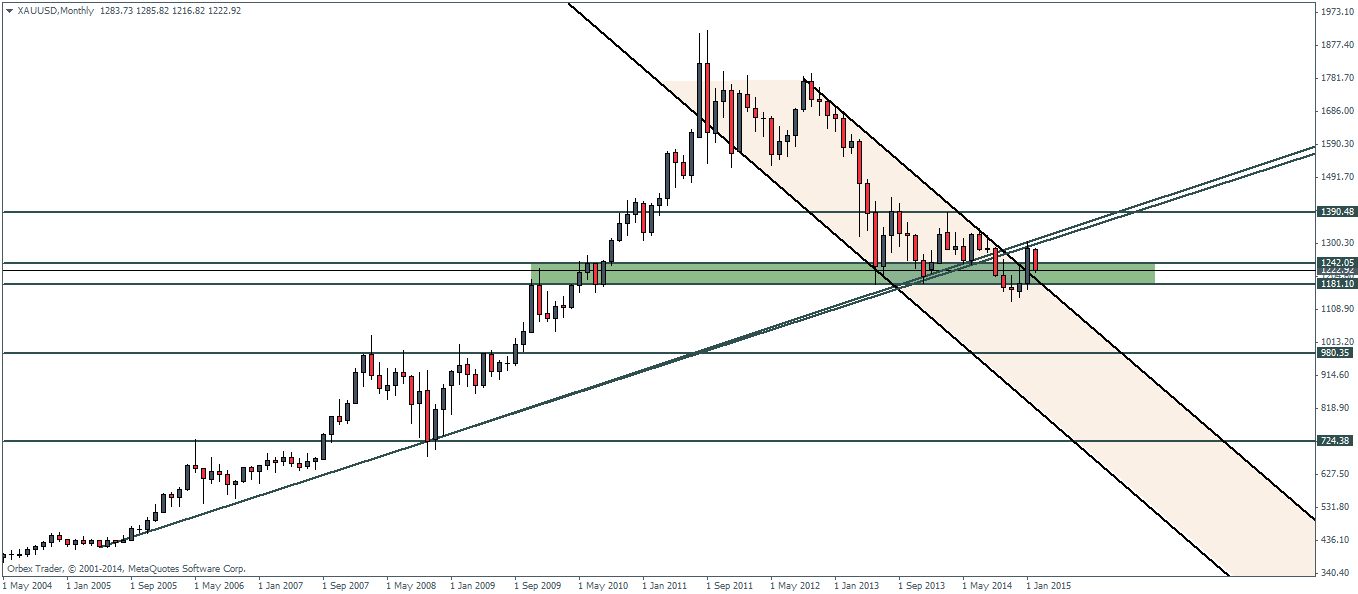
Looking to the monthly and weekly charts, we notice that in the monthly, price has reversed and is currently bearish after testing the highs of 1300 which makes it an ideal retest of the break down level. But considering price is in the major support/resistance level, we can expect to see a bit of choppy trading in the long term before Gold futures manage to find their direction.
With geo political risks fading, the demand for Gold has also been subdued. However, the Dollar strength is one of the key factors influencing the price of the precious metal. As such any inference to the Dollar’s strength from the FOMC could send Gold higher in the near term. Today’s main risk comes from the US retail sales data.
Silver Futures – Technical Update
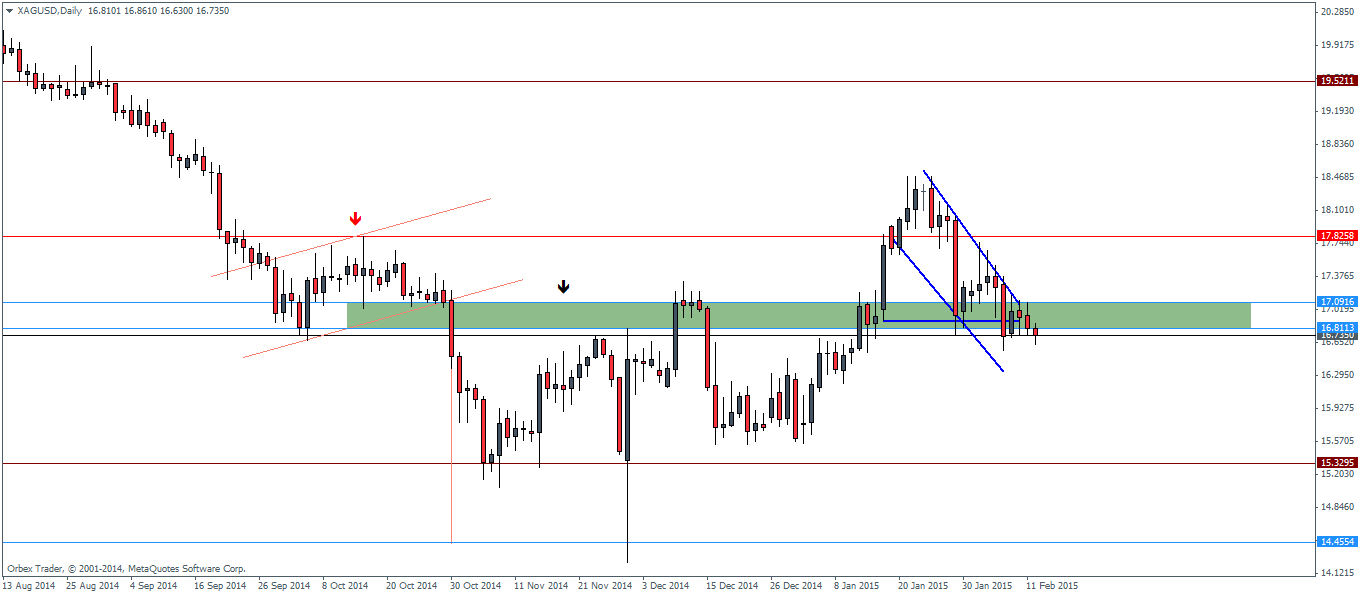
Silver futures failed the bullish flag pattern, currently trading below the 16.8 handle. A close below this level could see a decline down to 15.32, however there is scope for a possible reversal to the upside from the current levels. Only a confirmed close above 17 will put the bullish bias back into the picture with the eventual target of 19.
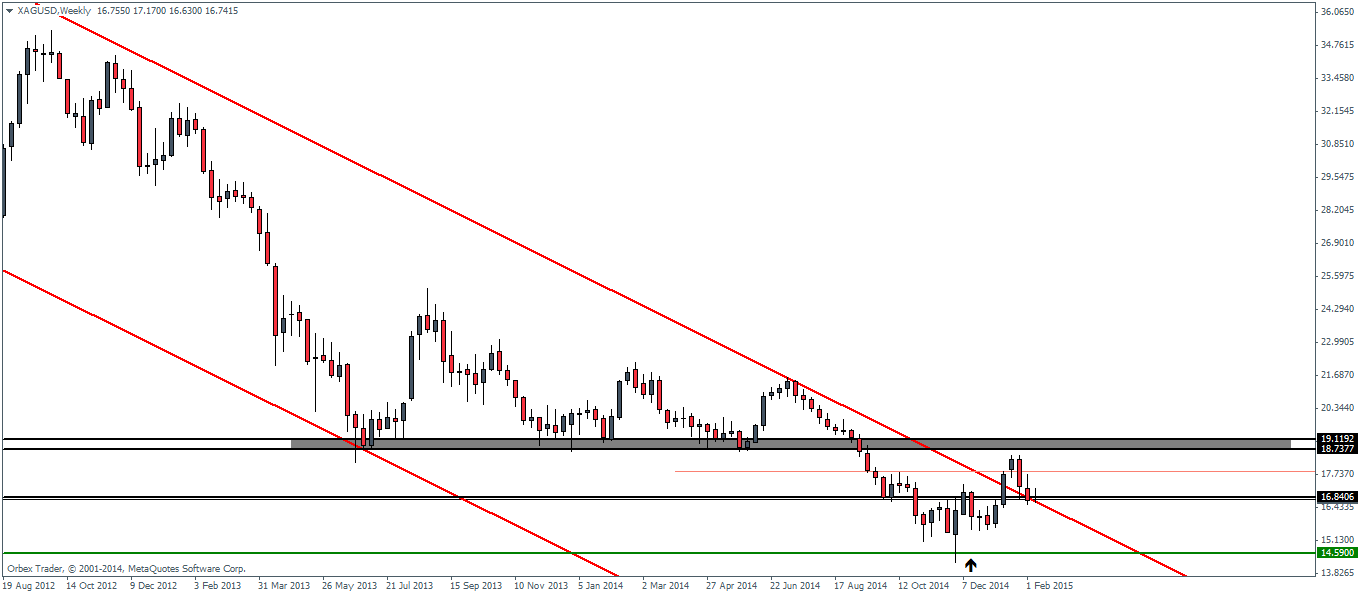
From the weekly charts, we notice that for the past three weeks prices have been declining, marked by the bearish engulfing candlestick formed earlier, right below the support/resistance level. Price action at the moment is hovering near 16.8 levels, which could tilt the scales either side. A break below 16.8 could see a decline down to 14.5 in the medium term while to the upside, Silver could possibly target the broken support at 18.73 – 19 for resistance before resuming its bearish trend.

![Credit Card 160×600 [EN]](https://assets.iorbex.com/blog/wp-content/uploads/2023/06/13144507/Blog-Banner_EN-Banner_160X600X2.webp)