
Crude, preparing for take off!
While the markets are focused on Crude oil inventory stock piles and the Baker Hughes rig count, from a technical perspective, we are starting to see that Crude oil prices are nearing their completion of a test to the downside before preparing for a push to the upside. As noted from our last week’s Crude oil technical analysis, we mentioned that there is a high likelihood of a dip down to $48.99 – $49 levels. For most of last week, prices were bearish, after falling from last week’s open of 53.48 to close lower at 49.91. At the time of writing, the weekly charts are pointing to a bullish price action. Of importance, is that we notice this week’s opening price at $49.63, few points lower from last week’s close. Therefore, should we notice a bullish close for this week; we could well expect to see a rally continue without a retest to the region of $48.99 – $49.
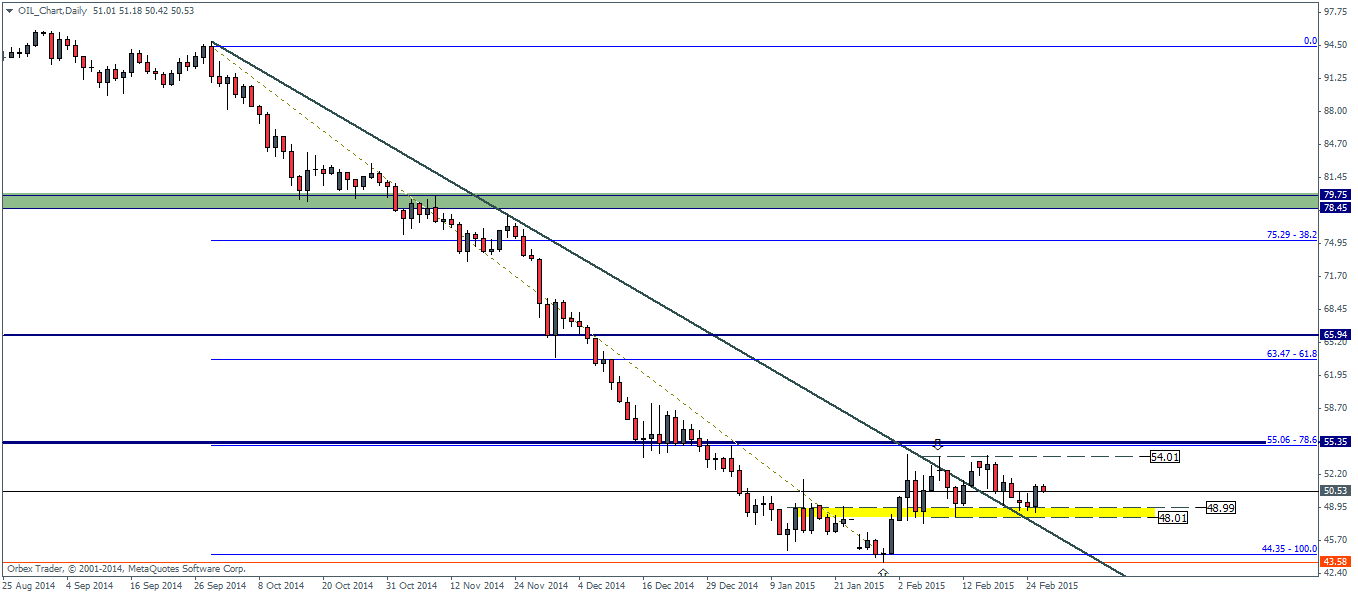
The daily charts for Crude oil show yesterday’s close being bullish after opening near the noted levels at 48.99, shown in the updated daily charts below.

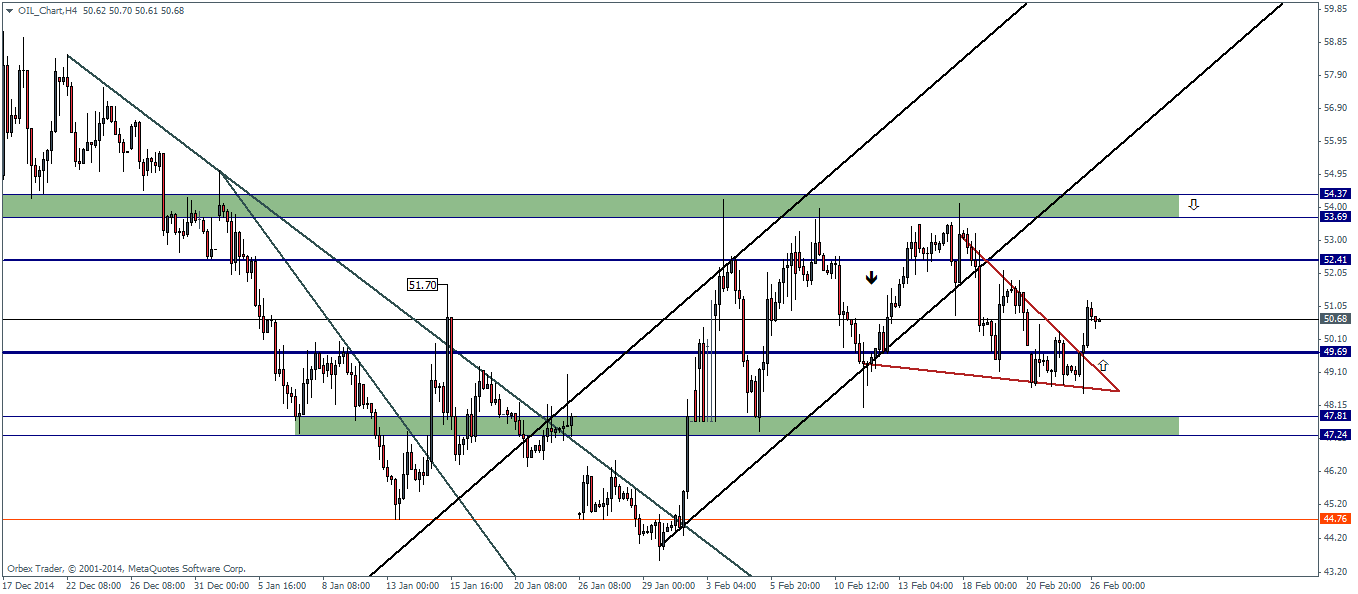
Switching to the 4-hour charts, we notice a triangle consolidation pattern taking shape. This pattern shows a likelihood of a dip to $49.69 – $49.7 levels from which we could ideally expect a bullish rally. However, in the likelihood that prices don’t retest the breakout level ofupsid the triangle pattern, a close above the most recent higher close at 51.02 is also well indicative of the move to the upside.
The 4-hour chshowshows an e minimum objective towards firstly the $52.41 level followed by another attempt to the established resistance at $53.7
The current price action at this point shows that the bullish moment could likely decline by the time prices rally towards $53.7 levels and we would expect another round of consolidation take place between 53.7 through 52.40 levels.
Within the larger scheme of things, the monthly charts do point to the fact that there exists further downside scope in Crude oil, wherein the most likely decline is expected to come near the $41.7 handle. The monthly charts also show that the major support that was broken in the decline comes in at 74.56 and 71.75, which could be tested at some point. However, it would be difficult to say if the current correction which could likely stall near $54 will continue to push higher. The monthly charts also do not show any conclusive evidence of a short-term reversal or correction taking place in Crude oil, with still one more trading day left for the month of February to end.
Therefore, bearing this mind, the price points near 54 through 53 will be of importance as a continuation from there on could see a rally towards an eventual corrective target of 74/71 levels while a reversal from the regions of 54/53 could see Crude oil resume its downside final objective towards $41.7 levels.

