
Crude oil correction takes a breather. But expect more upside gains!
The decline in Crude oil prices continues to take its toll on global economies with China falling victim to disinflation on account of the declining prices. With inflation being subdued globally sparking a string of monetary easing measures across various economies, one can hope for demand to pick up in order to help support Crude oil prices. Besides putting downward pressure on inflation, the falling prices have also taken their toll in US oil companies, with Halliburton, being one of the latest Oil companies to announce layoffs in order to remain more competitive in the markets. The last major layoff was from the oil companies drilling in the Canadian oil sands which is a relatively more expensive way to dig for oil.
Crude oil futures were in the news since late last week as the commodity managed to eventually lift off from its lows. As we have kept mentioning in the past, the foremost point to bear in mind is the fact that these upside moves are merely a correction to the downtrend. There is also the fact that the longer term analysis points to a decline towards the $40 handle.
But considering the declines have been rather sharp and quick, the correction we are witnessing now has been long overdue. While the price action for the past few days saw a bullish momentum building up, we notice this to be easing since yesterday and rightfully so.

The daily charts for crude oil shown below points to a downside move, especially after we notice the doji reversal pattern formed on the 9th of February. This begs the question whether if Crude oil will resume its decline from here on.
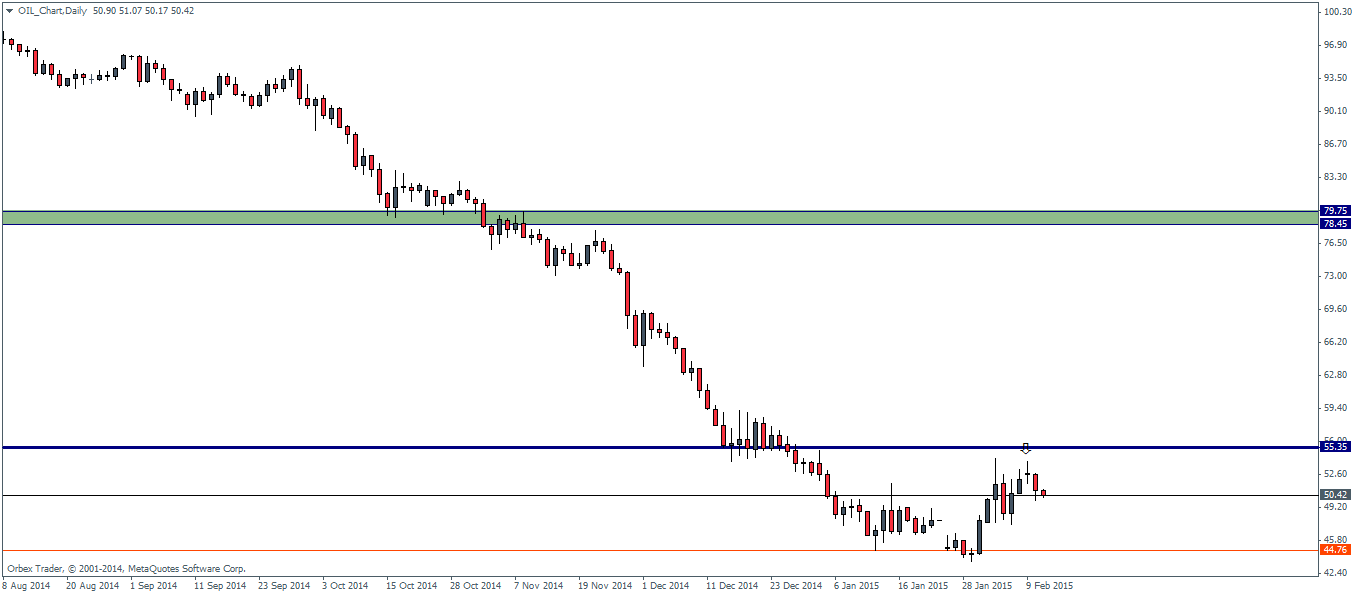
Technically, the support/resistance level sits at 55.35 and the fact that we notice a reversal well below this major price point at 55.35 tells us that Crude oil is likely to form a short term support level before targeting 55.35 initially.
We get better context of price action when switching to the 4 hour chart. Here we notice that the first support level comes in at $49.69 (or 49.70), followed by a next major support level at 47.81 through 47.24.
The 4-hour chart also validates the reason why we saw a reversal without breaching the 55.35 level. Price action managed to spike to 53.69 – 54.37 resistance zone, although we should ideally be noticing a close in this level. This price action is pointing to the fact that we could expect to see support levels being established before price action prepares to take out the resistance level above.
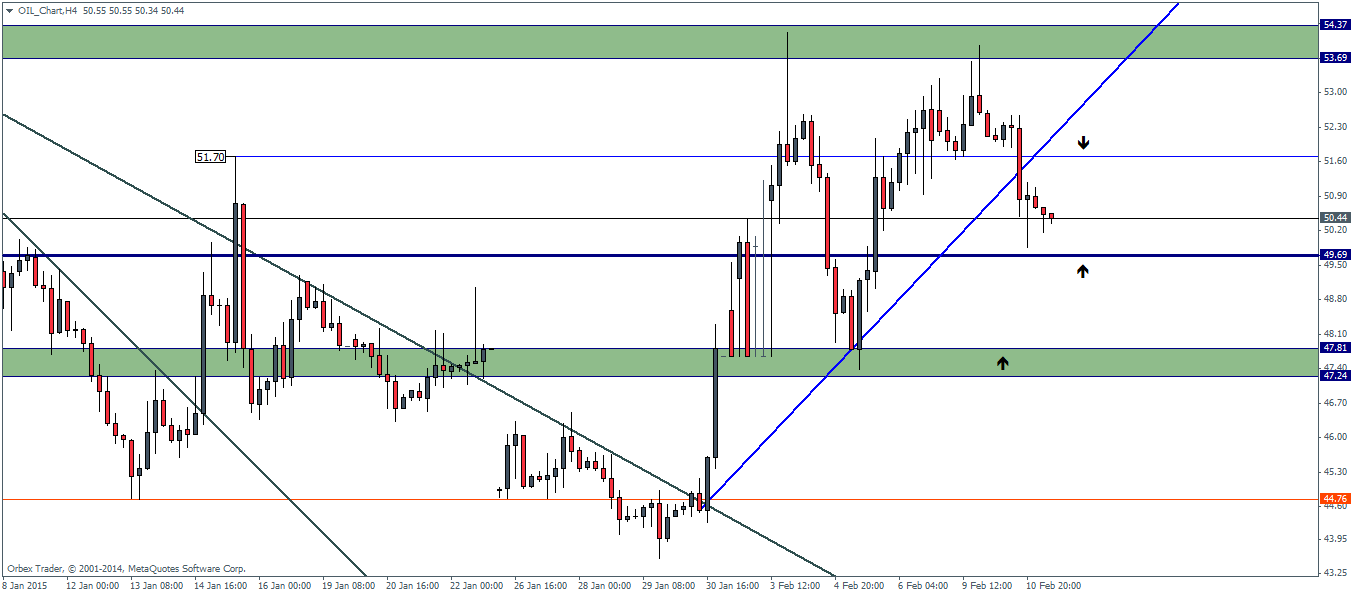
The 4-hour chart also points to a possible consolidation or sideways price action likely in the short term, as we expect price to bounce off the 51.70 through 49.69 and potentially down to 47.81
The US department of Energy will be releasing the weekly Crude oil inventories later during the US trading session today, which could potentially bring some volatility.

