The Dollar index continues to remain puzzling to say the least. With the latest FOMC statement done with, the technical analysis points to a possible correction in the Greenback. However, going by the statement, which the markets consider to be quite hawkish, the Greenback could possibly be expected to continue to grow stronger.
In its latest statement, the FOMC noted the strong growth in the labor markets while standing by to hike interest rates in the latter part of the year. The Fed shrugged off the weaker inflation reading as calling it a short term phenomenon and expects inflation to pick up later in the year as the labor market continues to improve. However, looking to the most recent jobs data, an unexpected decline in the average hourly earnings coupled with the lower inflation reading (something which has plagued most of the other Central bankers) the markets continue to remain skeptical about a potential rate hike for June 2015.
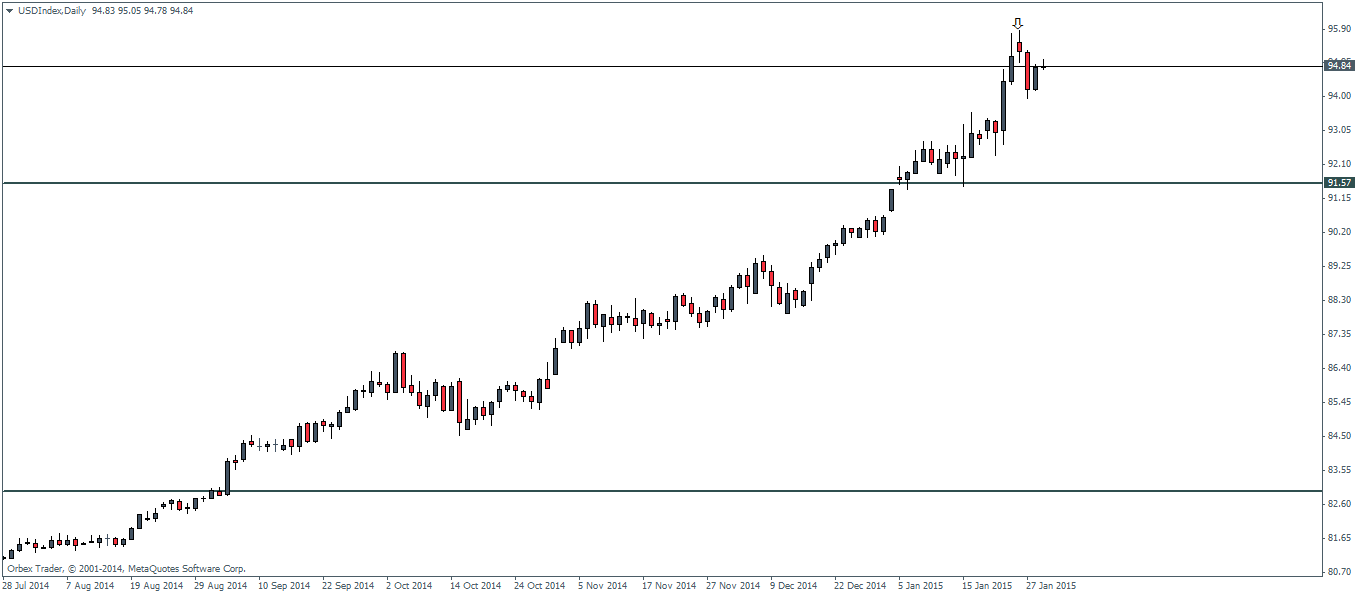
Technically, looking at the Dollar Index charts, one simply cannot ignore the bearish shooting star type of a reversal candlestick that was formed earlier on Monday this week. This bearish candlestick was later followed through by another bearish/lower close with the Greenback managing to trim its losses only in the backdrop of the Fed’s statement yesterday.
However, as long as the highs of 95.85 is not breached, we can expect to see the Dollar index continue to look downwards, with the most immediate support level coming in at 91.57.

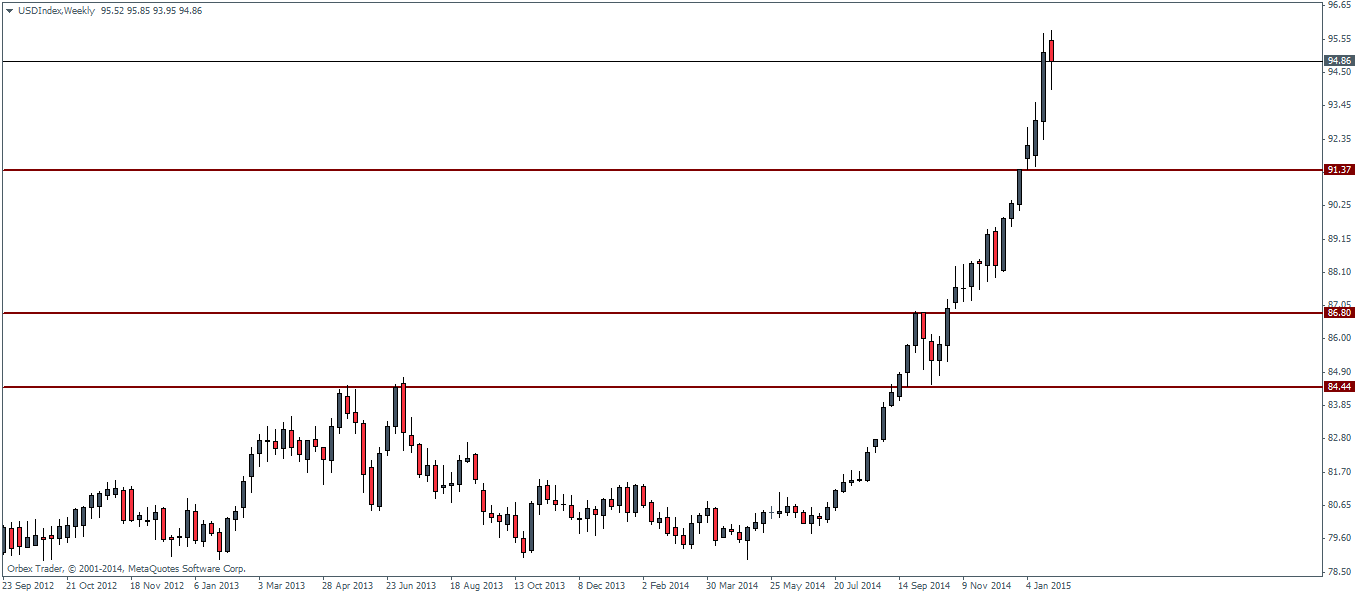
The weekly charts, also paint a grim picture for the Dollar Index. With still two full trading days left for the week to close, there could however be a glimmer of hope. In the event that Friday’s advance GDP data from the US comes out weaker than expected, we could possibly see the weekly candlestick close lower and mostly as a dark cloud cover reversal candlestick pattern. The appearance of this pattern near all time yearly highs makes for a perfect recipe to short the USD. The weekly charts also show an unfilled gap near 91.41, which in all likelihood will be the downside target should we expect to see further declines.
In an alternative view, should we continue to see the US Dollar chug along higher, it will take quite a while to see some clear and quick moves. The fact that the bullish momentum has been fading since the past few weeks further reiterates the fact that there are severe downside risks to the US Dollar Index in the very short term.
To summarize, the US Dollar Index looks a bit weaker as it struggles to climb higher. The Fed induced dollar positive sentiment has failed to do much for the Greenback. The technical patterns suggest a downside risk to the US Dollar index, which could possibly see the Greenback fall to as much as 91.37 before managing to stabilize and push higher.

![Credit Card 160×600 [EN]](https://assets.iorbex.com/blog/wp-content/uploads/2023/06/13144507/Blog-Banner_EN-Banner_160X600X2.webp)