
In the previous article we gave a brief introduction to trend lines and why they work, as well as showing how to plot trend lines correctly. If you have missed that article, please click here to read, in order to gain context for the next part of this trading strategy.
Support and resistance
We know that trend lines are nothing but a dynamic form of support and resistance. However, in the world of support and resistance, the strongest support and resistance levels are the horizontal levels. Note that we do not mean a single price point but an area or a zone.
In the trend line break trading strategy, plotting horizontal support and resistance levels are relatively easy. Remember we said that we need at least two contact points to plot a trend line? Well these very contact points forms the support levels or resistance levels.

The chart below illustrates this visually.
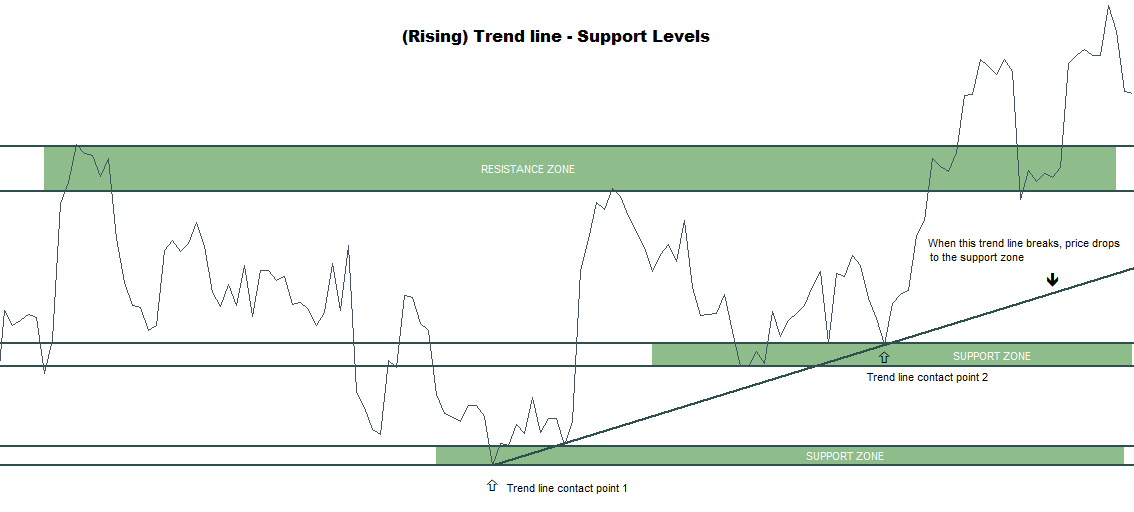
In Figure 1, after the trend line is plotted connecting two lows (lower closing prices), we then identify the support and resistance levels. Starting from left to right, we first identify the resistance level. Because we see two sharp price reversals, we plot the resistance zone. Similarly, for support zones, we merely look at the two contact points of the trend line and plot the support zones respectively.
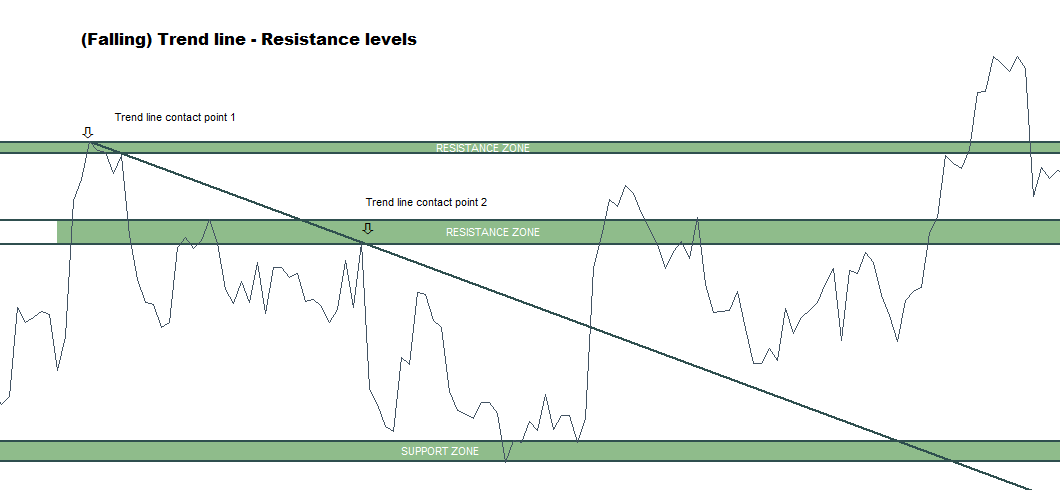
In figure 2, we have an example of a falling trend line that was plotted connecting the two consecutive lower highs. We also identify the potential resistance zones as well as the lower end of the support zone. In this chart, we notice how after price broke above the falling trend line, price immediately rallies to the first resistance zone, and upon break of this resistance zone, price then rallies to the second resistance zone.
Now that we have an understanding how the horizontal support and resistance levels, let’s get into the trade rules, which are defined as criteria and rules.
Set ups for long
- Switch to the line chart and using the trend line (Ray) tool, connect two consecutive peaks (higher lows)
- Scanning the chart from right to left, look for reversals and plot horizontal support and resistance zones accordingly
- Wait for price to break the falling trend line and mark the region of break out
- Place a pending buy order at the closing price or the first high after the break out targeting the immediate resistance level, with stops near the low formed prior to the break of the trend line
The following chart illustrates the long set up using the trend line break method for long set ups.
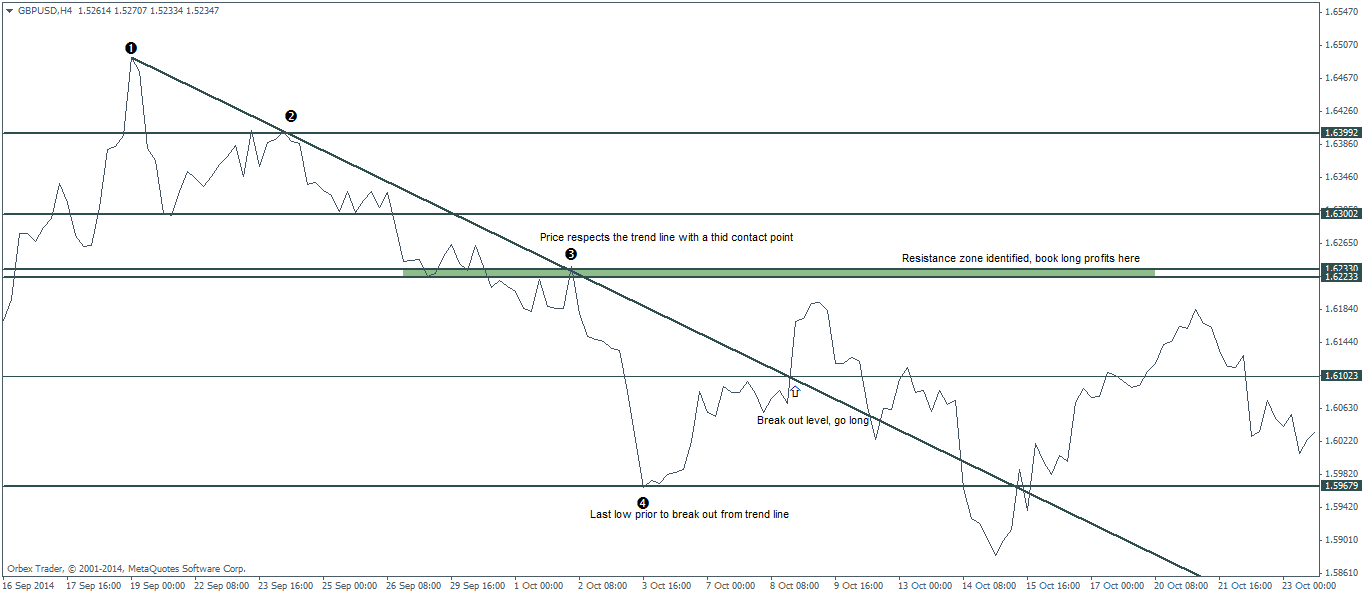
- The falling trend line was constructed after connecting the two consecutive lower highs (higher closing prices). Incidentally, we had a 3rd contact point where price reacted to the resistance of the falling trend line. Such set ups tend to be more valid on break out.
- Price then forms a low marked at point 4 and starts to rally. Here, we take a long position at the high that was closed just near the break out targeting the immediate resistance level
- The candlestick charts shows price breaking out and spiking up to the resistance level which was our intended price zone for taking profits.
Set ups for short
- Switch to the line chart and using the trend line (Ray) tool, connect two consecutive troughs (higher closing lows).
- Scan the chart from right to left and look for reversals to plot the support and resistance zones
- After price breaks the rising trend line, mark the region of break out
- Either set a pending buy order at the closing price or the low above the trend line targeting the immediate support level.
- The falling trend line was constructed after connecting the two consecutive lower highs (higher closing prices). Incidentally, we had a 3rd contact point where price reacted to the resistance of the falling trend line. Such set ups tend to be more valid on break out.
- Price then forms a low marked at point 4 and starts to rally. Here, we take a long position at the high that was closed just near the break out targeting the immediate resistance level
- The candlestick charts shows price breaking out and spiking up to the resistance level which was our intended price zone for taking profits.
The following chart illustrates the short position set up using the trend line break method.
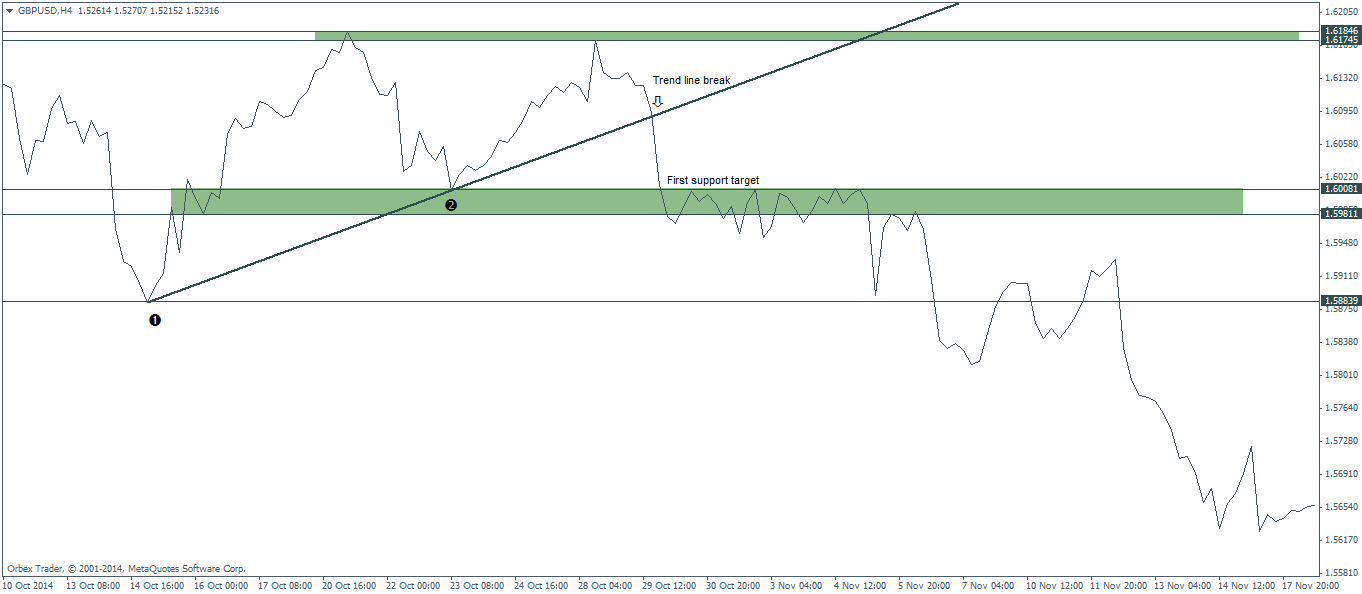
- After plotting the trend line at points 1 and 2 we then set up the support and resistance levels as noted on the chart.
- The break out of the trend line, which in this case was sharp and quick immediately saw price reaching the first support level which would be the target.
- The above chart illustrates the different ways the trend line break method can be used. In this example, if you would have missed the initial short position, notice how price formed resistance near the identified support level? This would be indication enough that price would drop lower to the next support level at point 1, which price eventually did.
Now that we have illustrated the basic rules of trading with the trend line break method, in the next article, we’ll introduce how to further strengthen the trade positions by combining them with candlestick patterns and also how the trend line break set up method can in fact be used as a chart set up for future price action as well.

![Credit Card 160×600 [EN]](https://assets.iorbex.com/blog/wp-content/uploads/2023/06/13144507/Blog-Banner_EN-Banner_160X600X2.webp)