Gold & Silver Update for the 9th January 2015
Gold Futures – Technical Update
With the US Dollar turning choppy for most part of this week and with the FOMC meeting minutes putting off interest rate hikes towards the later part of Q2 2015, Gold futures remained choppy as well. However, at the time of writing, Gold prices looks poised to close the first trading week of the year on a bullish note, but still trading within the major monthly support resistance level of 1242 and 1181 with no clear decisive moves being made yet ahead of today’s December nonfarm payroll data, which could possibly shift the sentiment either way. With no major risks of any geo-political uncertainty, it is likely that the price action that follows in Gold could be purely based on today’s US jobs data and the ensuing price action that follows.
A sample of which was noticed yesterday as the US weekly jobless claims missed estimates, rising to 294k above estimates of 290k, clearly showing that the rising Greenback is susceptible to any fundamentals that could possibly miss estimates.

Switching to the H4 charts, we notice Gold prices currently shaping out to form a bullish flag pattern, which tips the scales to a possible break to the upside, towards $1230, followed by $1245 levels as long as the support level of $1200 holds through.
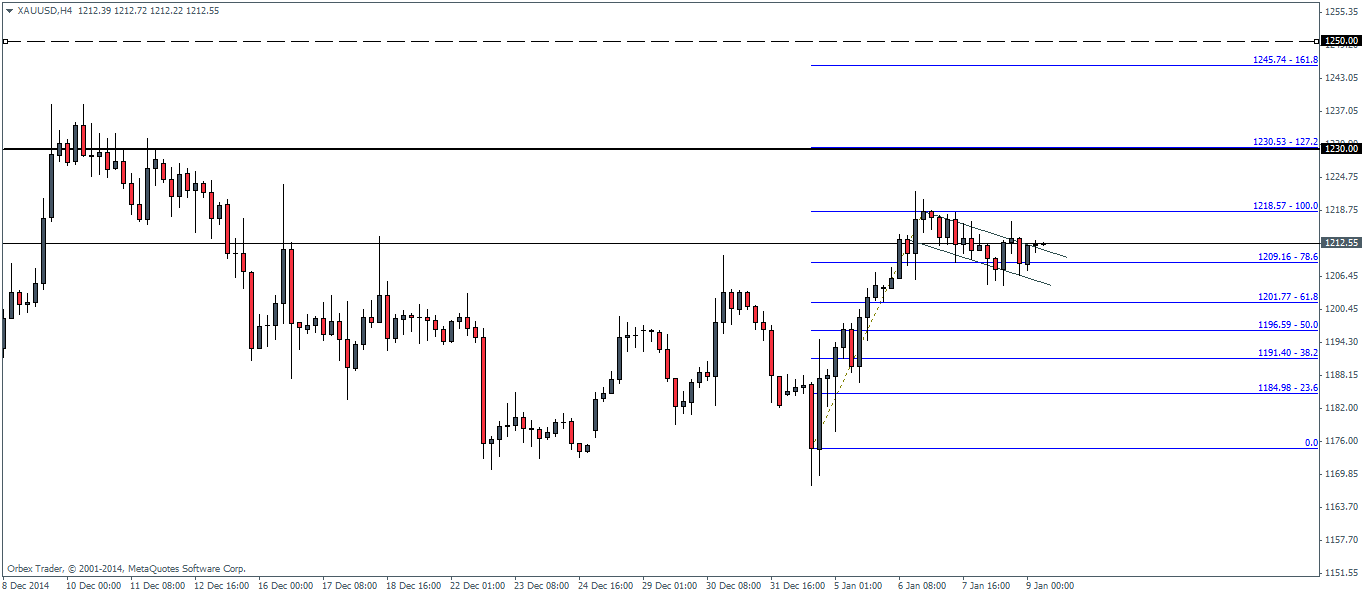
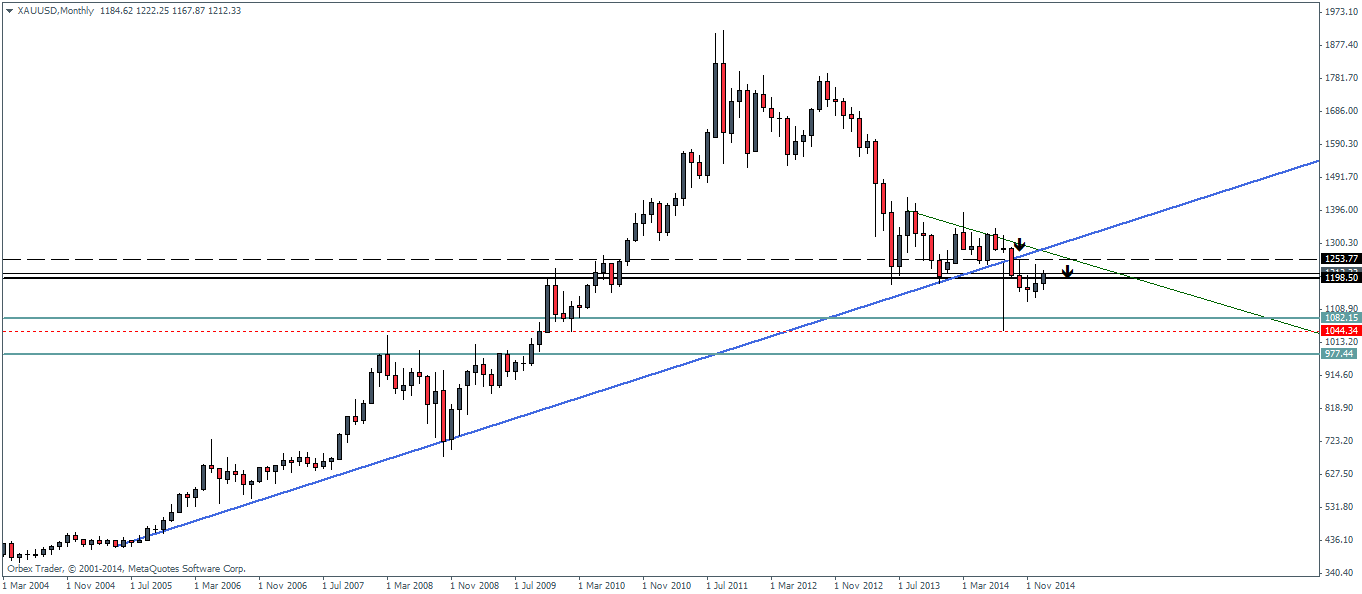
The rally towards $1250 is something which we have noted in past weekly Gold analysis as well, which marks the possible correction on the longer term time frame and one which could signal an eventual decline towards the lows breaking below $1100.
Silver Futures – Technical Update
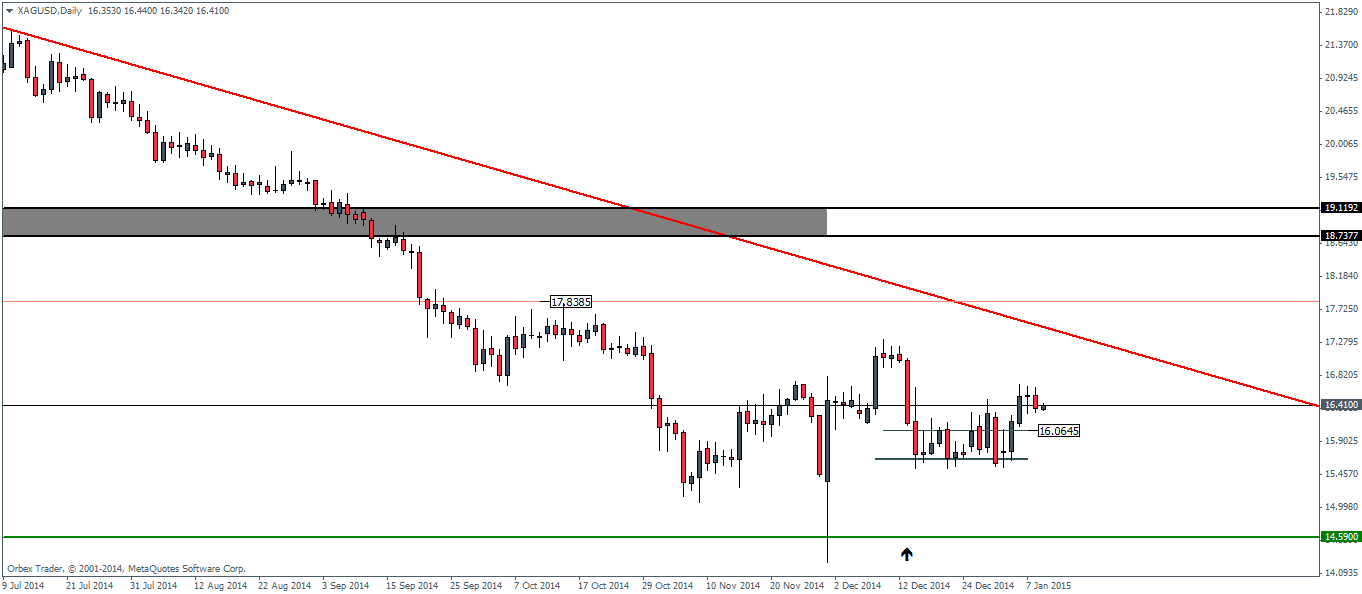
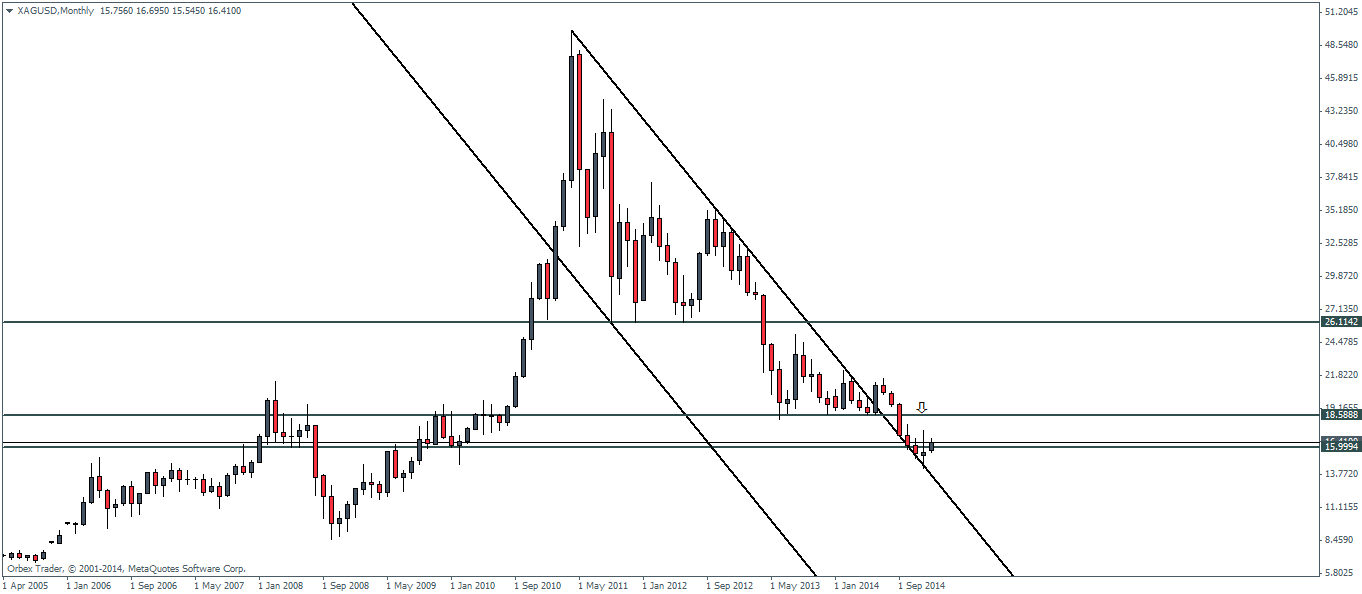
On the monthly charts, Silver prices broke out from a longer term falling price channel with last month’s candlestick closing as a near doji, which indicates indecision or shift in sentiment. A bullish close this month potentially puts the bias to the upside for Silver futures as prices hope to lift off from lows of 14.23.
The fact however remains that the price zone between 18.6 and 16 forms a longer term support/resistance level and price action within this zone is likely to remain choppy, unless we see a bullish break out above this level.
The daily charts show the consolidation phase that followed between the levels of 16.06 and 15.66 with a break out to the upside. Current price action could likely see a test down to 16.06, which if it holds could see Silver rally to target the next high of 16.81 – 17 levels.
The price level of 15.66 however looks strong and a break below 16.06 could possibly see Silver struggle to break lower. The longer term bias of course remains bearish for Silver.