
The Swiss National bank had surprised the markets last week after it decided to charge negative deposit rates at -0.25% on sight deposits held at the Central Bank. The move was triggered largely due to capital inflows from the crisis ridden Russia as Russian investors fled to safety. This sudden influx of capital put upward pressure on the Swiss Franc, which prompted the SNB to make it less attractive for investors to hold funds in the Franc.
The move however had wider implications as the markets were expecting to see a negative deposit rate being charged after the ECB played its hand first at QE, which is seen to considerably weaken the Euro. With the SNB coming out first with the negative deposit rates, it is quite likely that any dips of EURCHF to the SNB’s floor of 1.20 will see aggressive buying by the Swiss National bank.
The markets were definitely not too impressed with the SNB’s preemptive move and could potentially see the EURCHF dip back to test the SNB’s nerve.
After spiking to as high as 1.2096 on the news of negative deposit rates by the SNB, EURCHF soon settled back lower and looks continuously bearish threatening the floor. The SNB’s intervention in the markets is likely to keep the floor stable.

In this view, most of the CHF crosses, with the exception of the Euro could likely benefit from the SNB’s intervention in the markets. The USDCHF, GBPCHF and AUDCHF are some such pairs that could benefit vastly from the SNB’s actions.
Technically, for most of the CHF crosses, last week’s candlestick formed a bullish piercing line candlestick formation, indicating a move to the upside. The USDCHF could be the major beneficiary of the Swiss Franc’s weakening by physical intervention considering that the Greenback is currently the stronger currency amongst its peers. Although the US Dollar is susceptible to today’s vast number of data releases, the overall long term up trend for the USDCHF remains intact.
The daily charts for USDCHF show price rallying off a rising trend line and we do notice a small bearish divergence to the 13 day RSI, which points to a corrective decline to 0.9674 levels.
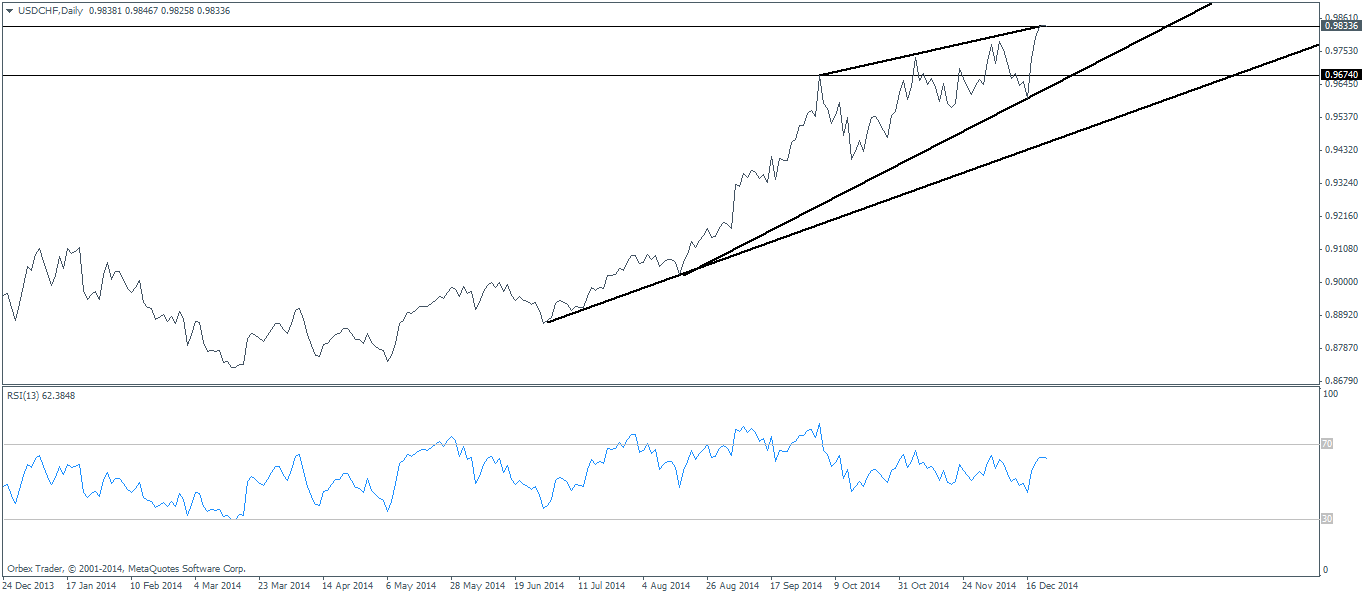
Figure 1 USDCHF Daily Charts, RSI Divergance
The correction should be fairly limited in view of the weekly charts, which shows a strong bullish engulfing candlestick pattern being formed, while a major support has been established at 0.96725 level, which could probably be tested in what could result in a sharp pin bar like candlestick pattern.
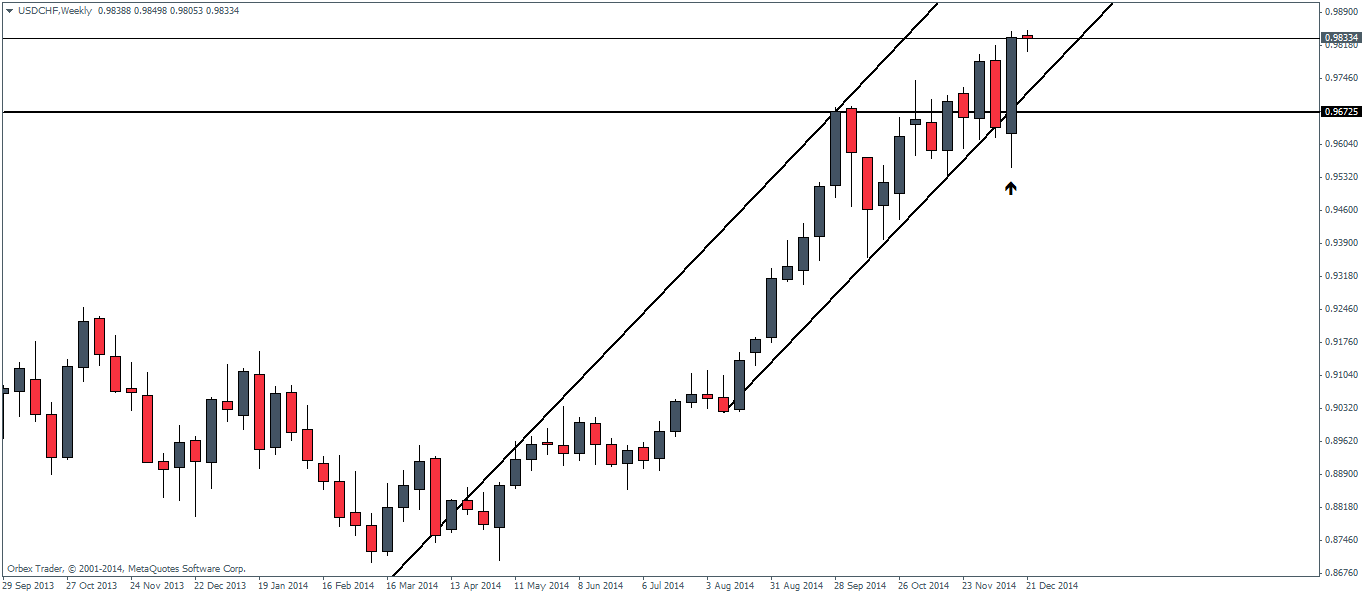
Figure 2: USDCHF Weekly Charts, Bullish Engulfing
The bullish engulfing candlestick pattern also looks to be very strong considering that price engulfed not just the body of the previous week’s candle but also the highs and lows. Furthermore we also see a gap down from the previous week’s bearish close. Taking the above into consideration, USDCHF shows a strong confluence of the RSI divergence and the weekly support level, which makes 0.96725 – 0.9674 a highly possible prize zone from which we could see renewed buying into the New Year.

