
Gold Futures – Technical Update
Gold futures managed to push higher on the monthly charts but eased back from the monthly highs at 1238.32 levels. Considering that a retest of the minor support at 1253 region is critical for any downside gains, Gold could likely continue to test this broken support for resistance to pave way for declines on the monthly charts with the objective of reaching towards 1082 – 1044 levels. In terms of the candlestick patterns, the price action shows a doji type of a candlestick formation on the monthly charts. Therefore this month’s closing candle will be of importance. Should Gold futures close bullish on the monthly charts, we could expect to see further upside gains.
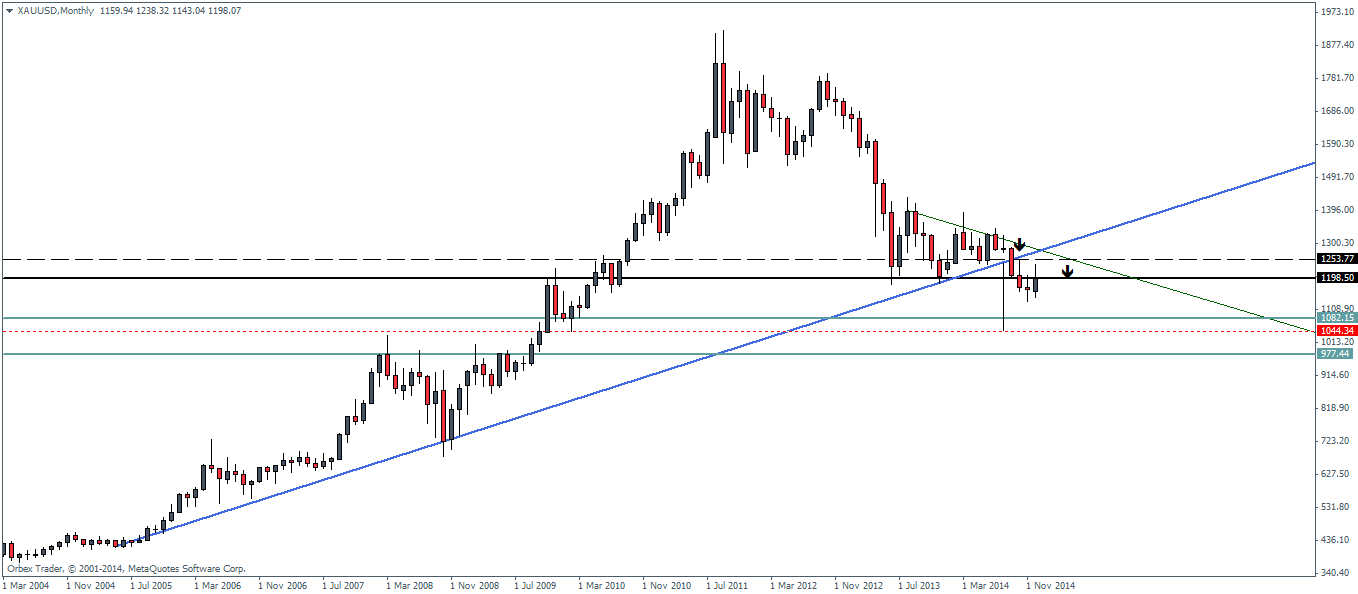
Figure 1: Gold, Montley Charts (Long Term)
When looking to the weekly charts, we notice Gold easing back down to the main support level at 1197 – 1186 price zone. A test of this support will show confluence with the monthly price action with the intention of seeking gains towards 1253 region. With last week’s weekly candlestick closing on a bullish note after what seems like a piercing candlestick formation the week before, Gold futures are technically poised for further gains.

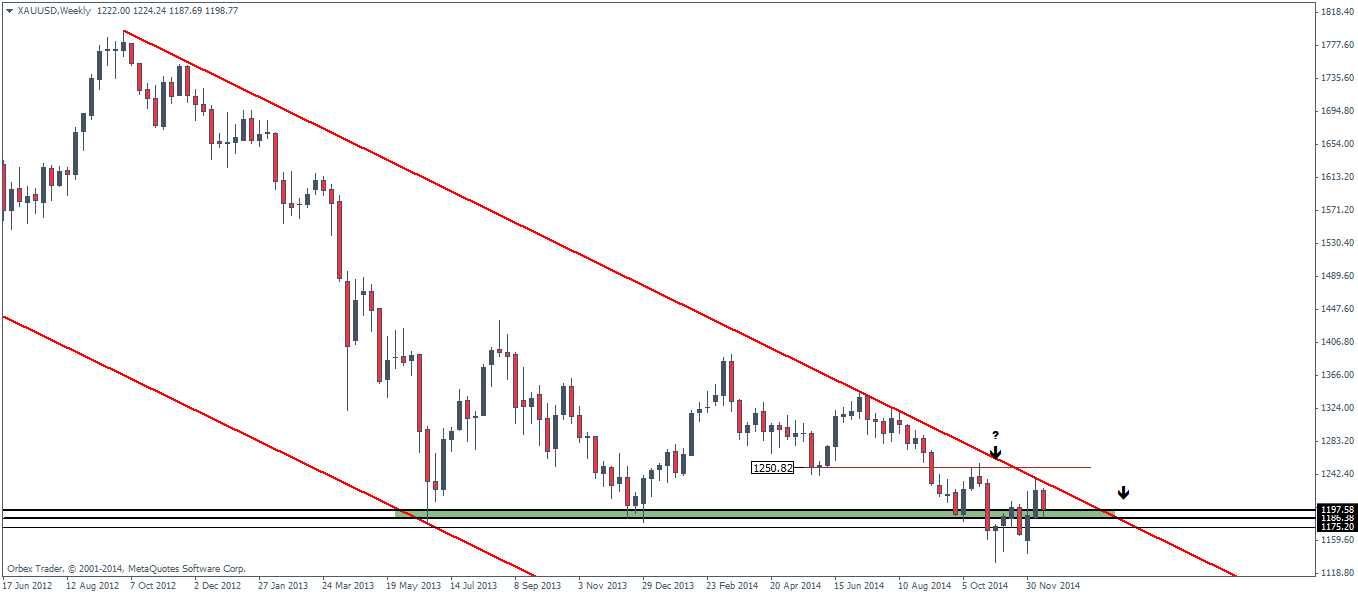
Figure 2: Gold, Weekly Charts
The H4 charts shows price currently below a medium term trend line at the support zone. A break above this trend line could potentially signal the rally in Gold futures within the week. The main risk however comes from the Median lines that are plotted on the H4 which shows price failing multiple times to touch or even spike towards the upper median line. Therefore, in this context the trend line will be important as a failure to break higher could see Gold futures possibly dip lower towards 1175 region before it can rally any further.
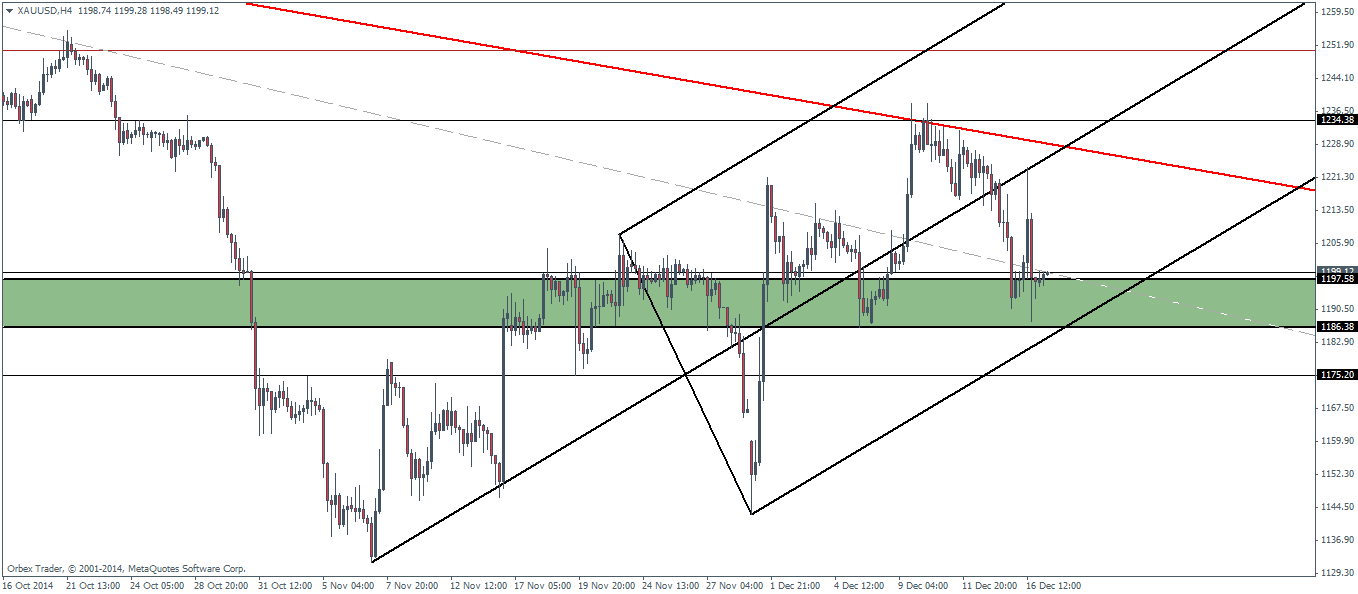
Figure 3: Gold – H4 Charts
Gold Pivot Levels
| R3 | R2 | R1 | Pivot | S1 | S2 | S3 | |
| Weekly | 1295.55 | 1266.54 | 1244.5 | 1215.89 | 1194.45 | 1164.84 | 1142.4 |
| Daily | 1253.69 | 1238.63 | 1217.82 | 1202.76 | 1181.95 | 1166.89 | 1146.08 |
Silver Futures – Technical Update
The monthly charts for Silver futures shows the current monthly candlestick already engulfing the highs and lows of the previous month, clearly seeking for direction. Price however did not manage to reach the price level of 17.83 with the monthly high so far being made at 17.32.
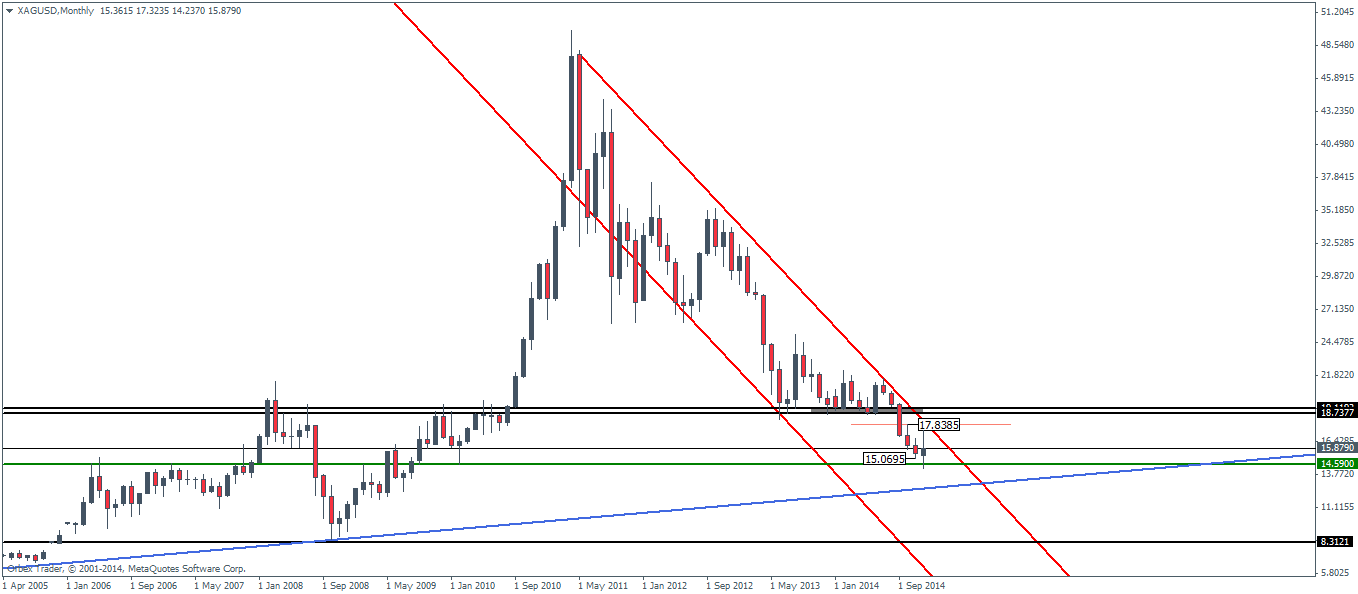
Figure 4: Silver Futures Montly Chart
From the weekly charts, we notice the piercing line candlestick formation two weeks ago after a brief spike to 14.59 levels, which was then followed by a bullish close last week. If price manages to hold above last week’s high of 17.32, we could expect a rally to 17.83 and as much as to 19.11, which would see price break out from the falling price channel and could turn the stage for bullish price action in Silver.
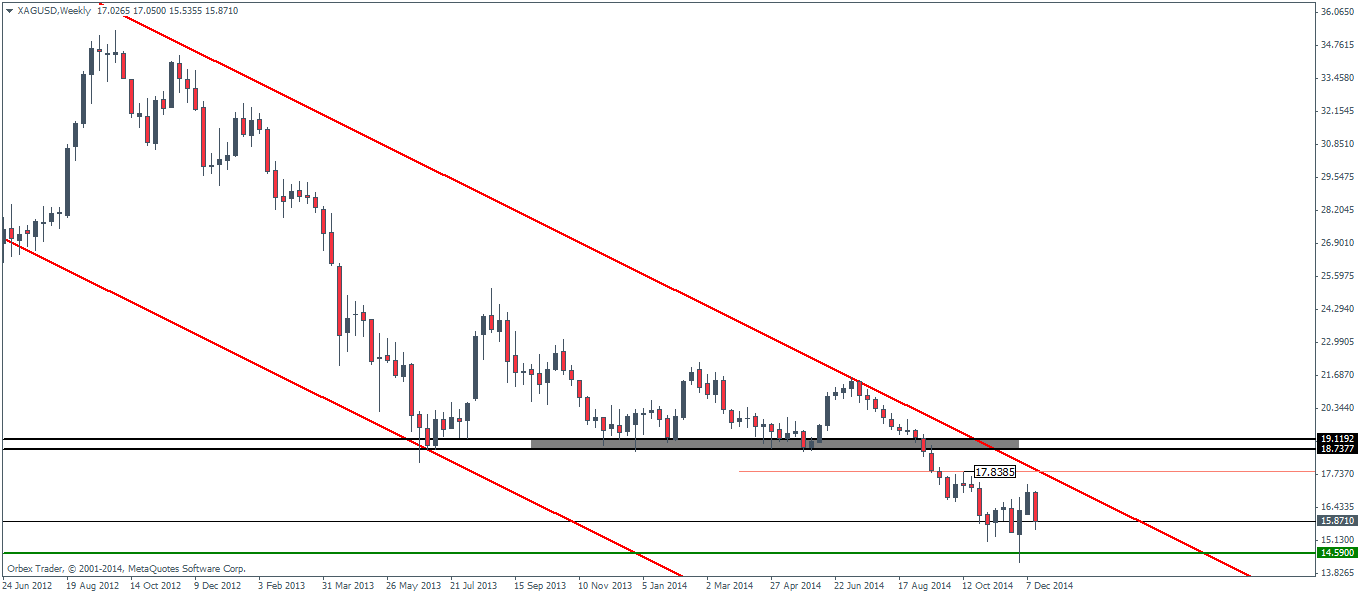
Figure 5: Silver, Weekly Charts
The main price levels to watch for will be 17.12 and 15.33 levels as a break out to either side could see sharp rally targeting 18.79 or a decline down to 13.61 levels.
Silver Pivot Levels
| R3 | R2 | R1 | Pivot | S1 | S2 | S3 | |
| Weekly | 18.66 | 17.99 | 17.5 | 16.83 | 16.35 | 15.67 | 15.19 |
| Daily | 17.52 | 17.09 | 16.4 | 15.97 | 15.28 | 14.85 | 14.16 |

