
Technical Preview of Crude Oil: As global crude oil prices continue to drop, OPEC countries cut pricing to maintain their market share
Crude Oil prices hit a multi-year low as both the technical and fundamental outlook for WTI Crude continues to be bearish, reaching as low as $77 a barrel during the week. Saudi Arabia cut its prices to the US as the state owned oil producer, Saudi Aramco in an emailed statement announced that it would further discount prices by $0.10, besides the $1.05 discount already in place.
As crude oil prices continue to plummet, the OPEC countries have been in a rush to cut their pricing while increasing Oil production in a bid to maintain their market share which has seen fierce competition from US shale oil drilling. The US, one of the largest Oil consumers in the world saw declining imports. For the week ending October 3rd, the US imports of Crude oil from Saudi Arabia fell 609,000 barrels a day
Yesterday’s EIA Crude Oil inventory report saw the Crude oil inventories in the US rising by 460k barrels against expectations of a rise of 1.9M barrels. The crude oil imports to the US declined by 426k barrels per day.

Crude Oil Technical Analysis
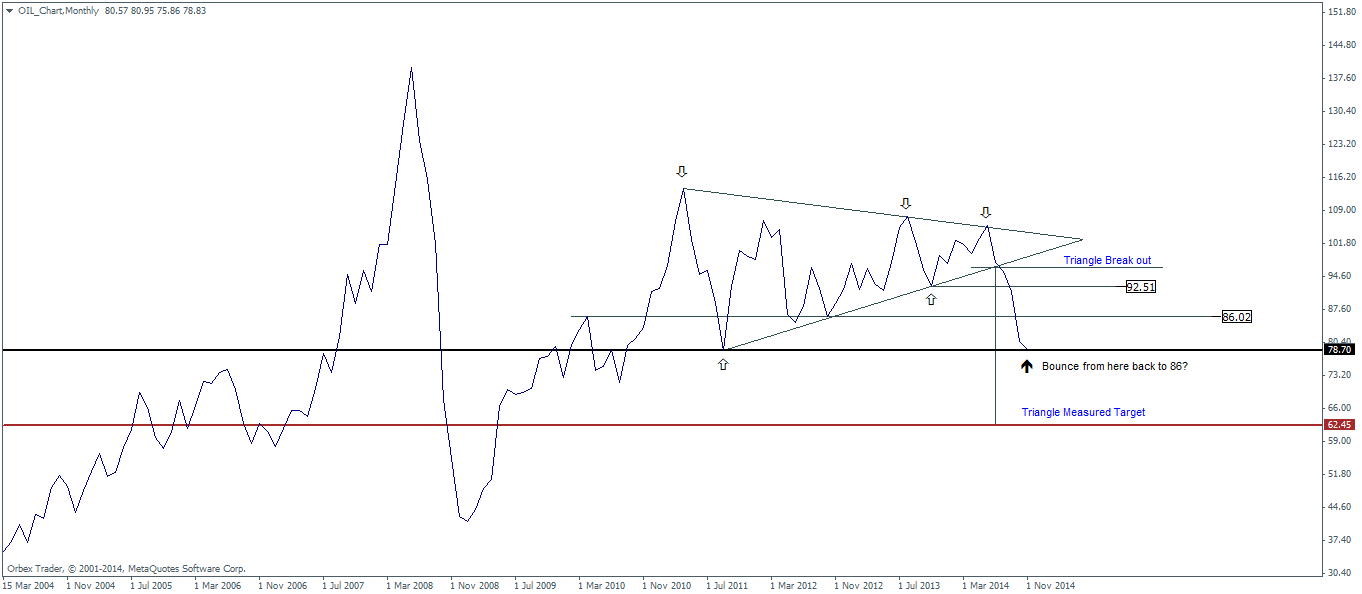
The updated monthly Crude Oil chart with the symmetrical triangle continues to be the chart to follow. Prices hit the first support level at 78.70. From here on, if the support holds, a brief rally to the region of 82 can be expected before Crude makes a nose dive to break the support at 78.7 levels.
While the Monthly and Weekly charts do not yet offer any clues, the daily charts are starting to show signs of reversal with yesterday’s price action engulfing the previous day’s open and close as well as making a higher high and a higher low comparatively. We would however need to see a more decisive confirmation candlestick to validate the price reversal at this support zone. Switching to an even smaller time frame shows a bullish engulfing candlestick but prices need to break the H4 trend line to confirm bullish price action.
Following up to the H1 charts and updated with the new price action since last week’s Crude Oil analysis, we can see a brief consolidation taking shape at the time or writing with what seems like a bull flag/pennant formation. A break out from this consolidation phase is likely to see Crude oil aiming for the psychological level of $80 followed by a possibly brief rally towards the weekly pivot level region near 81.12
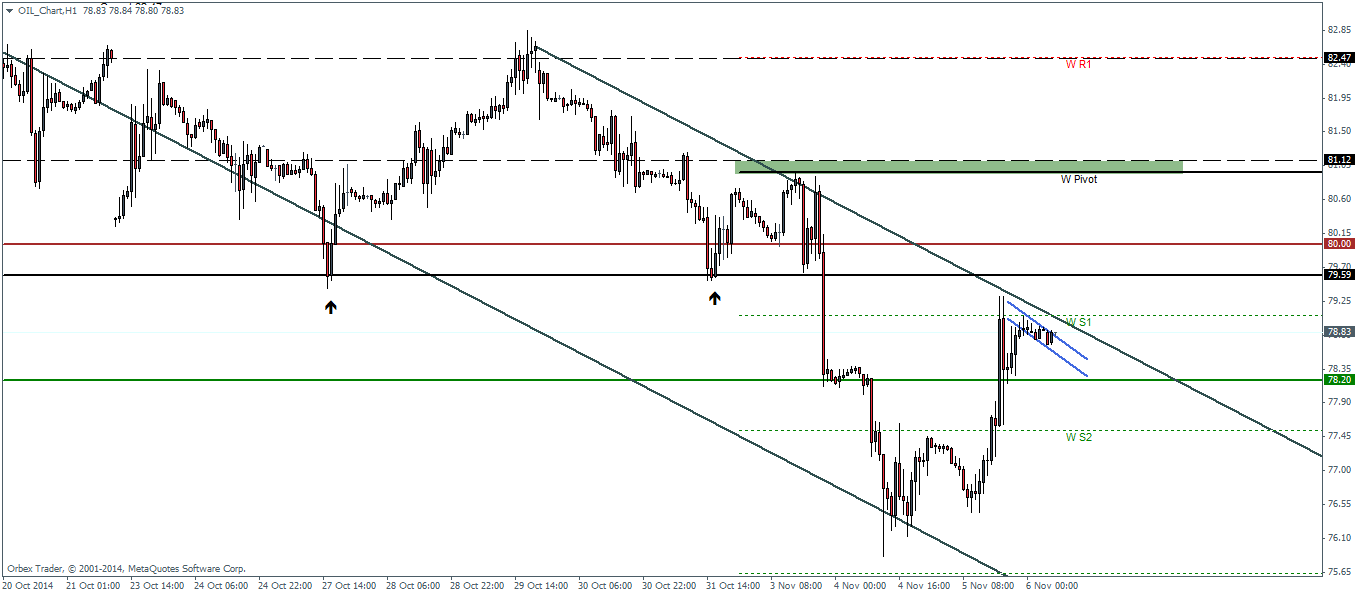
Alternatively, we could expect to see a fake out or a decline towards 78.2 to establish support before prices look towards pushing to the region of 80.
The key events for Crude oil for today is the OPEC press conference scheduled for 1PM GMT
Crude Oil Pivot Levels
| R3 | R2 | R1 | Pivot | S1 | S2 | S3 | |
| Weekly | 85.92 | 84.39 | 82.47 | 81.12 | 79.06 | 77.53 | 75.63 |
| Monthly | 103.16 | 98.05 | 89.32 | 84.21 | 75.48 | 70.37 | 61.64 |

![Credit Card 160×600 [EN]](https://assets.iorbex.com/blog/wp-content/uploads/2023/06/13144507/Blog-Banner_EN-Banner_160X600X2.webp)