
Introduction to Combining Fundamental & Technical Analysis
For most traders, it is either of the two; traders who strictly trade based on technical analysis or traders who strictly adhere to the fundamentals. However, practically speaking for the average retail trader, trading based off fundamentals can prove to be hazardous and time consuming. If you were a wealthy investor with deep pockets, it would have made sense to perhaps long the US Dollar against the Japanese Yen and continue to be long on this pair since the 98 levels seen last year. But for the retail trader, this is practically impossible unless your trading equity has deep enough funds and you as a trader have the patience and discipline to ignore the intra-day noise or even the monthly blip in the fundamentals.
It is therefore not surprising that the majority of forex traders tend to be more inclined towards trading with technical analysis which gives a more clear perspective within the short term while at the same time gives scope for traders to manage their risks accordingly.
But what if there was a middle ground where traders could combine the strengths of both fundamental & technical analysis?

Fundamental analysis is the study of the underlying forces that moves the security or the asset. In the context of currency pairs, fundamental analysts focus on factors such as inflation, employment numbers, GDP and so on. This basically tells you how good the fundamentals are which can then support the strength in the currency in question.
Technical analysis on the other hand is the study of past price history to forecast the near term price movements. It includes many subsets of studies, either based on reading the candlestick charts or based on indicators themselves.
While it might seem too good to be true, there is in fact many different ways for traders to combine the power of both technical and fundamental analysis to build a trade execution plan that offers logical trades with good risk management all within the short term time frame.
Flag Patterns – The most ideal chart pattern
One such method is to combine chart patterns that are closely associated to the fundamentals or news events that are being released. While there are many different chart patterns such as the Head and Shoulders, Cup and Handle, Flags and pennants, double or triple tops and bottoms to name a few, it is only the flags; the bullish and bearish flag patterns that come very close to reflecting the fundamental events.
The benefit of using or trading with flag patterns is that they are quick to form and are valid regardless of the time frames they are spotted on. In terms of the amount of time taken, flag patterns are quick to form and they offer good risk/reward when entered at the correct levels.
But what are flag patterns?
Flag patterns are termed as bullish and bearish flags.
A bullish flag is characterized by a large flag pole, indicative of a quick rally, usually within a couple of price bars followed by a brief period of consolidation which generally tilts lower (contrary to the previous direction), giving the pattern of a flag
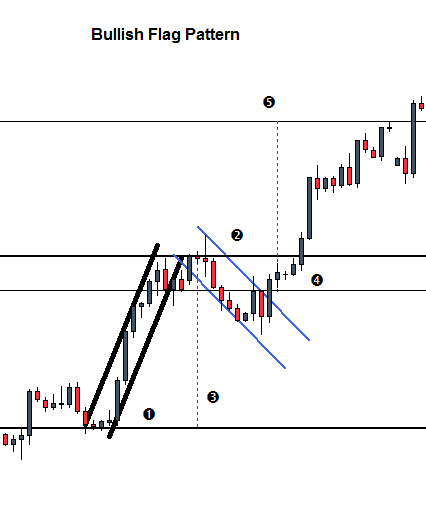
The elements in the above bullish flag example is explained below:
- Refers to the flag post. Notice the quick successive price bars which rallied to make a top
- Price starts to decline lower, in the opposite direction to the previous rally
- The distance from the start of the flag post to the end is measured
- And the measured distance is projected from the break out of the price channel in the flag
A bearish flag is characterized by the large flag pole, indicative of a quick decline within a couple of price bars followed by a brief period of consolidation which tilts higher, giving the pattern of an inverted flag (or perhaps a hockey stick).
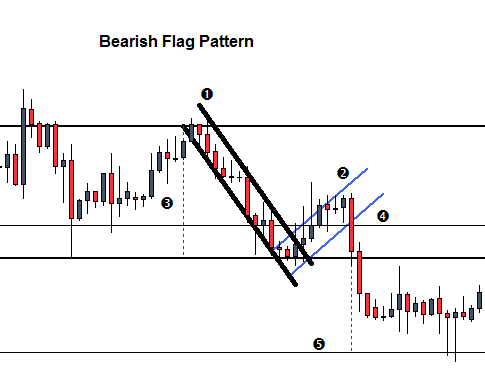
The elements in the bearish flag pattern are explained below:
- Indicates the sharp decline in prices with successive bearish price bars
- After price bottoms out, it makes a bounce and moves counter to the previous price direction
- The distance of the flag post is measured
- And the distance is projected from the break out of the price channel of the flag post
From the above two examples, we can see that the sharp declines are usually caused by some fundamental events and this is more evident when looking at flags on the H1 or H4 time frames which closely relates to intra-day news events.
Now that we have a basic idea of the flags, in the next article, we’ll take a look at the different types of flag patterns and how to draw then correctly.

![Credit Card 160×600 [EN]](https://assets.iorbex.com/blog/wp-content/uploads/2023/06/13144507/Blog-Banner_EN-Banner_160X600X2.webp)