
Gold has been testing the 1300 barrier since the beginning of this year, with no clear break above that resistance so far.
And now is the fourth time; so here comes the big question, is it the right time for gold to break that barrier? If so, where are we heading?
Interesting Weekly Close
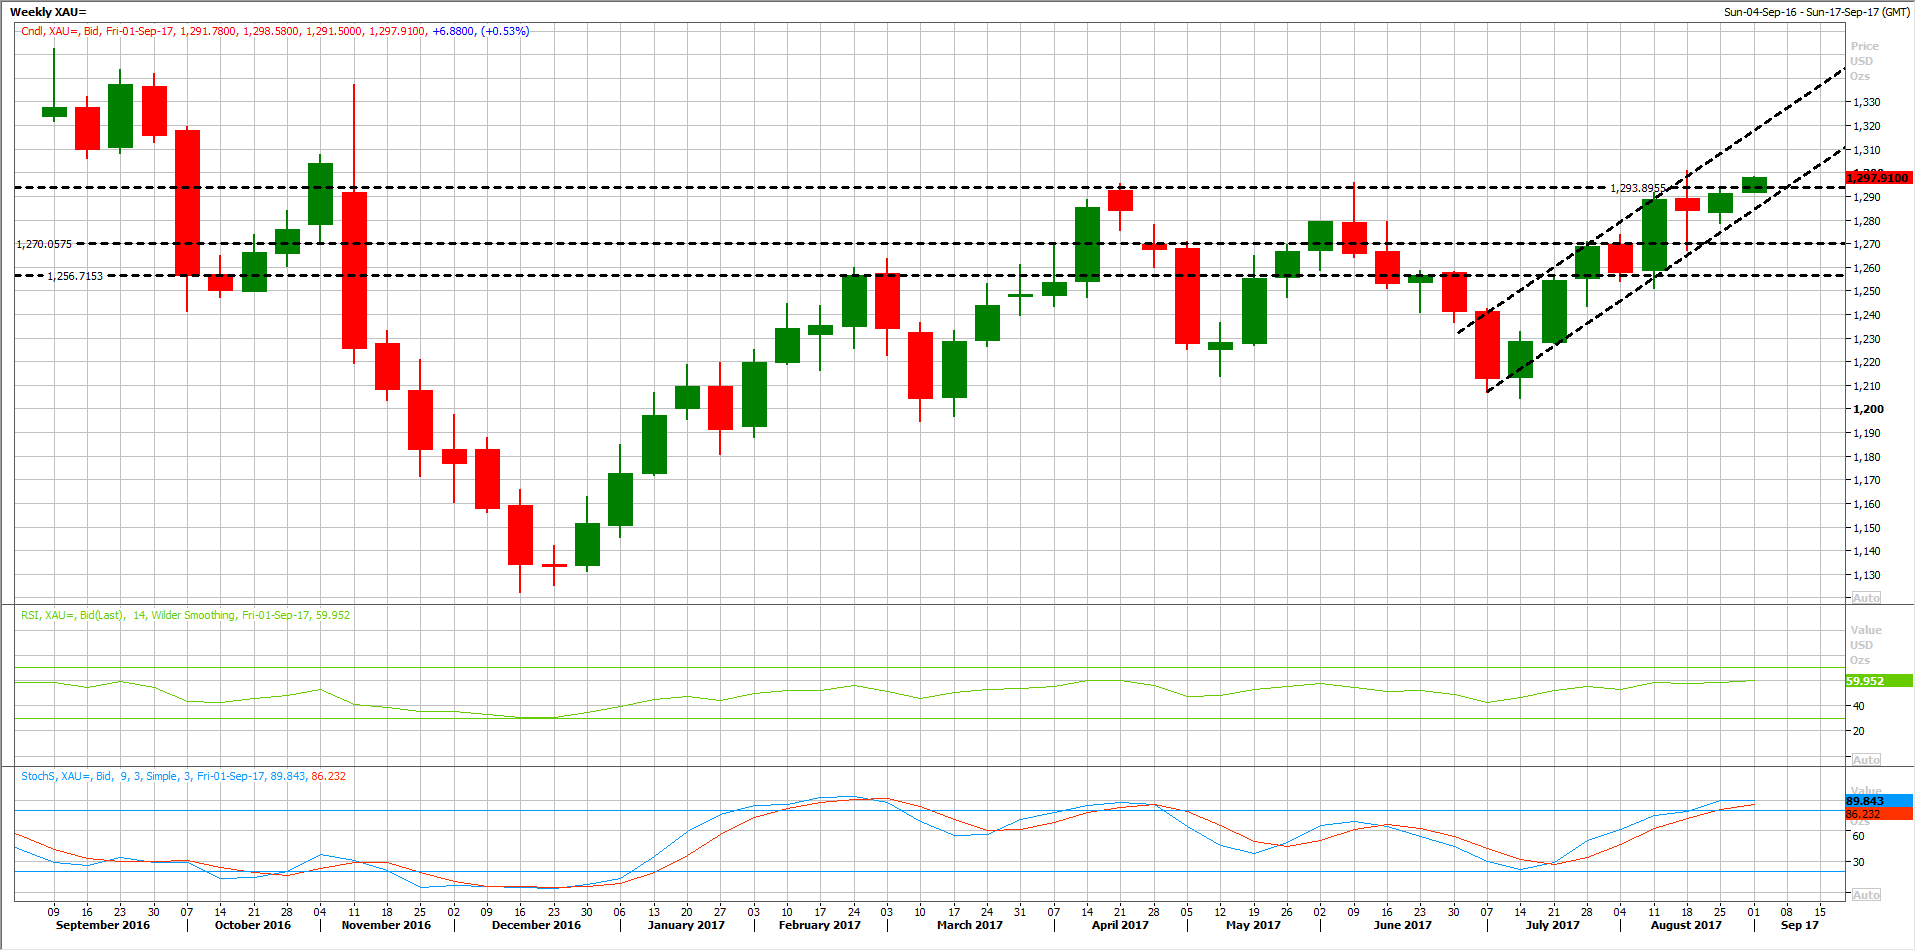

Last week, you might say that Gold failed to break above 1300 barrier, just like the previous attempts this year.
However, there is something that you might be missing. Look at the weekly close once again, you will find that this is the first time Gold closes above 1290 since November of last year. We never saw a weekly close above 1290 this year, until last Friday.
This is one of the most interesting weekly close in Gold this year, which might be the first significant close since Q3 of last year.
Keep An Eye On The Monthly Close
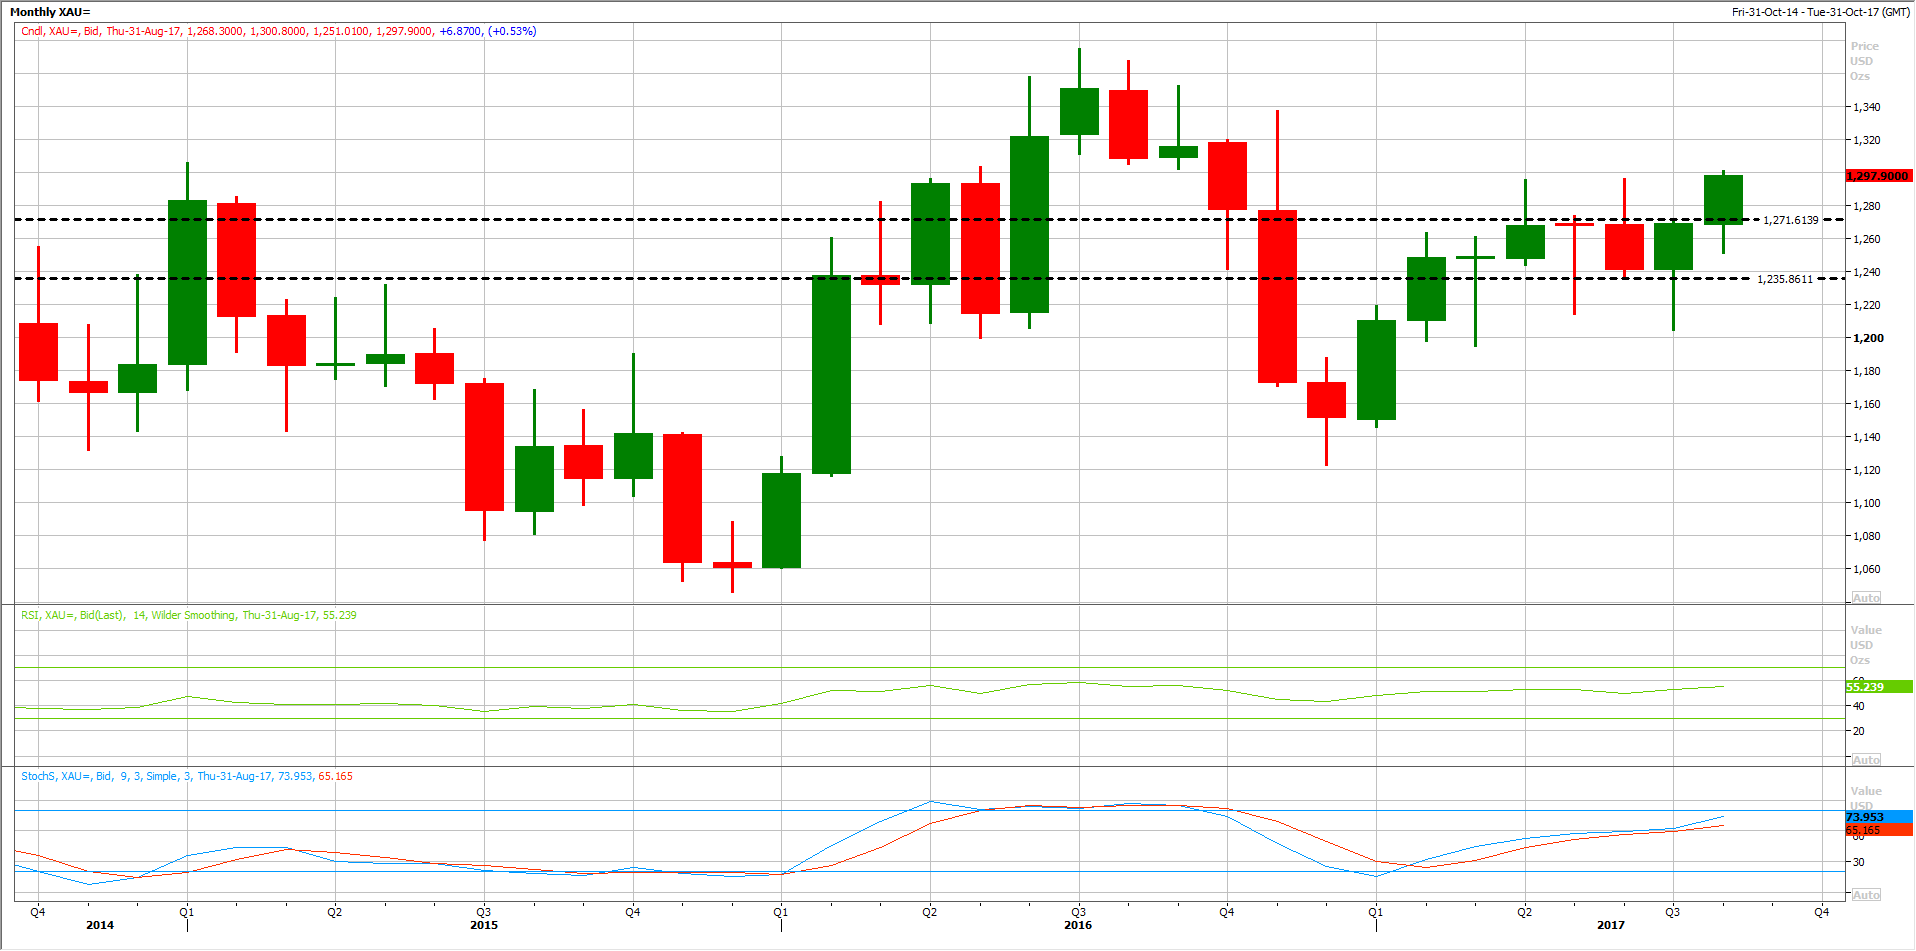
Daily and Weekly remains positive, but now let’s have a look at the monthly chart, which is few days away from a breakout formation.
Looking at the monthly chart, Gold has been trading within the same tight range between 1290 and 1200 for the past five months, with no clear breakout of this range.
This month’s candle is promising as the price remains near the high of this month and above the previous range. Yet, a monthly close above 1290 is needed to confirm such breakout. If so, we will be looking for another bull run not less than 5% to 6%.
Traders Are Still Betting On More Gains
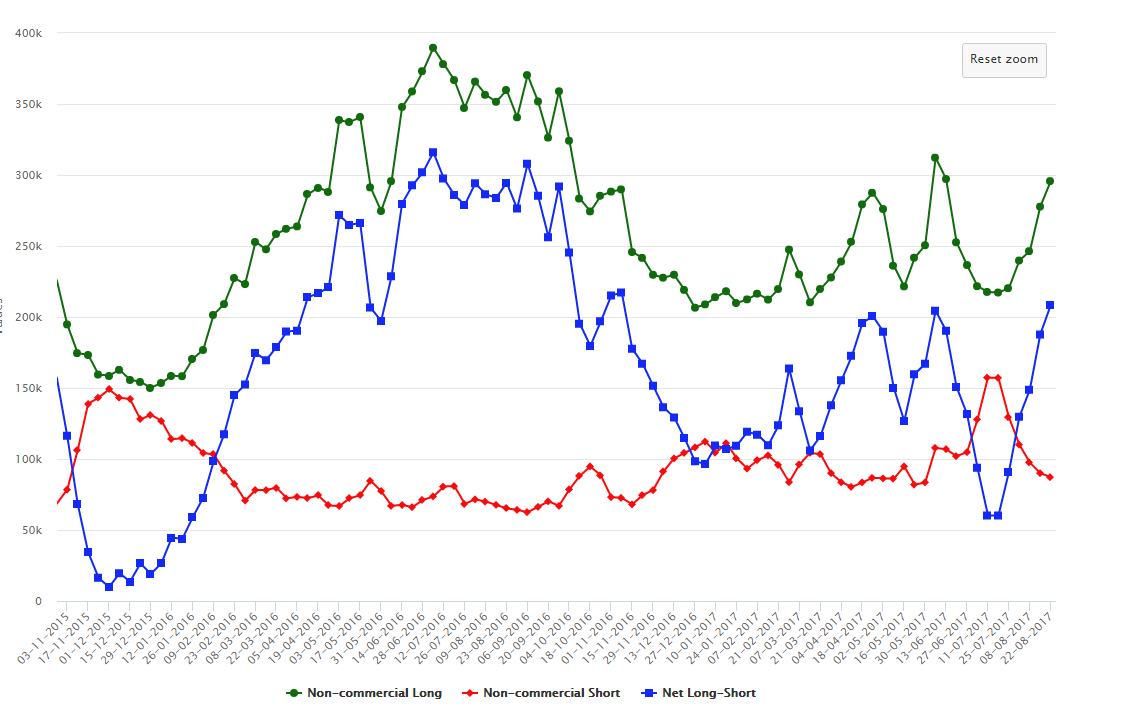
Looking at the latest Commitment of Traders Report by the CFTC, we can see that traders are still optimistic.
Non-Commercial Longs increased for the fifth week in a row, rising to the highest level since June of this year.
Moreover, the Non-Commercial shorts has been declining for the past six weeks, declining to the lowest level since May of this year.
Such change in Non-Commercial Longs and Shorts has led the Net Long/Short to rise for six weeks in a row, reaching the highest level since August of 2016.
Hedge Funds Buying Gold Once Again
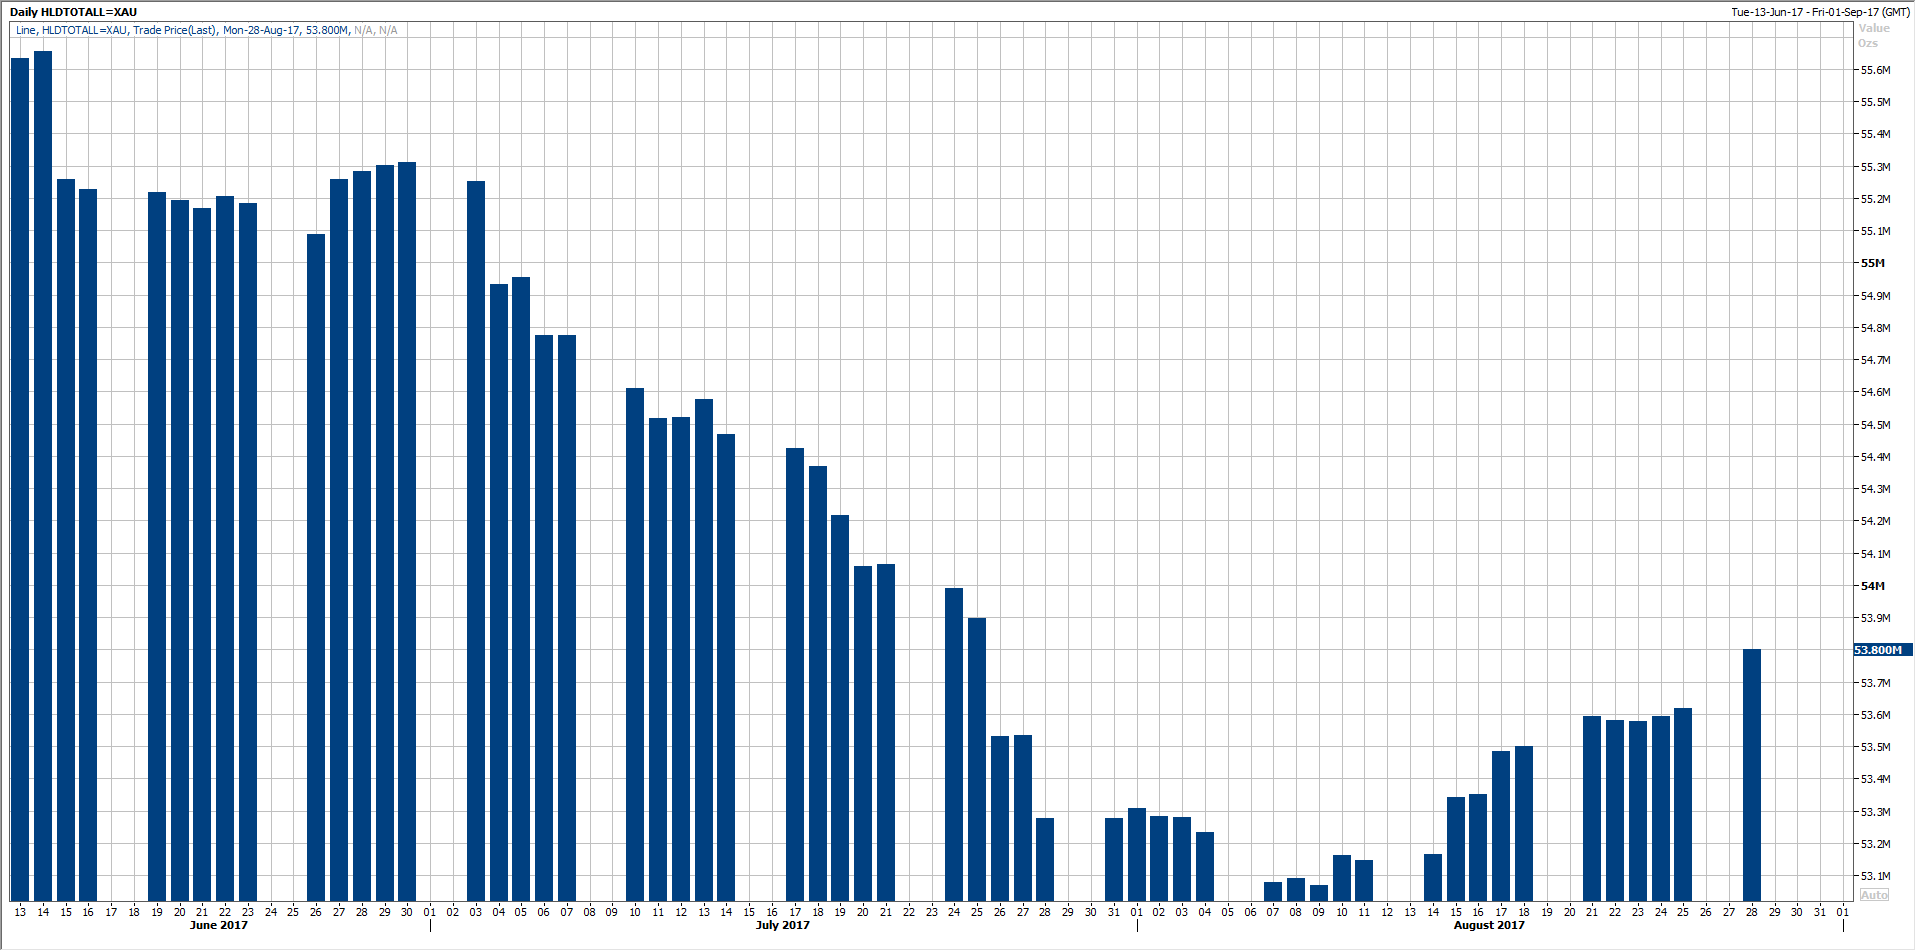
Looking at the last known physical holdings of Gold, we can notice that it has been rising since the beginning of August, rising to the highest level since 24th of July.
This comes after one full month of consecutive declines as shown on the chart. This is also despite the fact that Gold has been rising gradually and mostly stabilized in July.
But it seems that hedge funds started to get the sense of Gold strength, so it might be the time for them to increase their holdings once again.
What Do We Need?
Traders are advised to be very careful over the next few hours. So far, Gold is solid above 1290 and still trying to push higher.
Yet, we need a clear break above the $1300 barrier over the next few hours/days. Such break would be the only signal to start buying the breakout formation. Otherwise, standing aside would not be a bad idea.
A breakout above the 1300 barrier, would clear the way for quick rally, probably toward 1320 followed by 1340, while 1360 and 1370 would be seen later in September.

