
The precious metal has been relatively stable over the past 7-days after prices initially fell sharply to $1250 handle. Earlier this week, US economic data included the monthly inflation figures which showed headline CPI rising 0.30% on a month over month basis in September as expected. Core CPI grew less than expected at a pace of 0.10%, missing forecasts of a 0.20% increase and slower than 0.30% from August.
Other secondary data over the week included the New York area manufacturing index which fell further into the negative territory to -6.8 while industrial production figures were also weaker, rising only 0.10% in September with the figure for August being revised down to show a 0.50% contraction.
As noted in last week’s gold weekly outlook, prices have remained flat with $1250 support seen holding out so far. The daily chart shows price action trading within the range from October 7th and could signal a breakout in the near term. To the upside, the target remains at $1300, while to the downside, a breach of $1250 could extend the declines to $1200 psychological support.
Bullish forecasts for gold from LBMA

The London Bullion Metals Exchange or LBMA was in the headlines this week as the delegates gave a bullish forecast for gold. Meeting in Singapore at the Annual 2016 LBMA conference, a survey of the people attending the event expect gold prices to trade near $1347.50 an ounce in a year, which is about 7% while silver prices are expected to appreciate by over 18%.
Just a year ago, LBMA survey showed a forecast of $1160 for gold prices. Adrian Ash, head of research at BullionVault who was covering the event in Singapore called it “mildly bullish” while Dick Poon, general manager at Heraeus Metals Hong Kong Ltd. said, “Gold may surge to $1,400 in 2017 as the Federal Reserve holds back from further monetary tightening in at least the first half after an increase in December.”
Gold – Technical Outlook
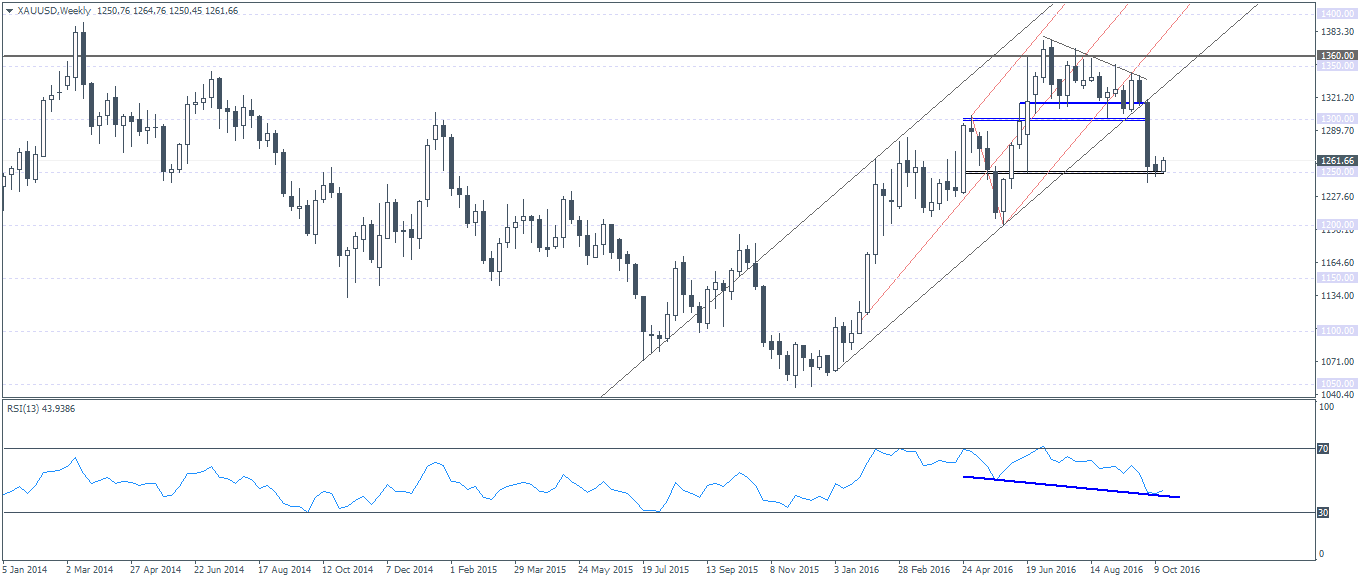
The weekly chart for gold prices shows the previous declines coming off following the breakout of the descending triangle’s support level at 1300. Price has now fallen to the 1250 handle which could offer some support capping the declines. In the near term, a retracement back to 1300 cannot be ruled out with the resistance level near 1300 – 1314 likely to be tested on a rebound from the current support.
Only a weekly bullish close could signal the upside bias for the moment. Alternately, if prices break down below 1250 support, we could anticipate near-term declines that could eventually push prices lower towards the 1200 handle.
The support at 1250 also gains attention with the 13-period RSI currently signaling a hidden bullish divergence with the higher low being formed on price and a lower low on the RSI. This basically validated the upside move, unless price breaks down strongly below 1250 on the weekly session.
As far as the near-term catalysts go, today’s final US presidential debate could influence gold prices. However, as far as economic data is concerned, most of the remaining economic releases are confined to the housing sector in the US. The Bank of Canada and the ECB meetings remain in focus which could shape the outcome of gold prices this week.
Next Friday’s advance GDP report for the US remains a key event risk as far as economic data is concerned. While gold is poised for a rebound to $1300, the price action could remain muted for the most part with some gains seen coming only closer to the ECB meeting and the advance GDP report. Still, watch for a potential bullish close on the weekly session which could signal the start of the retracement.

