Gold prices staged an impressive rally last week touching highs of 1375.29 on 6th July. The gains came as market sentiment briefly soured pushing investors to bid up the price of precious metal. As gold surged to a 2-year high, price has started to retreat just as quickly. The declines this week has been more pronounced, especially with the fast changing geopolitical landscape. The broader outlook for gold remains supportive of the precious metal as interest rates outlook, prospects of more QE from various central banks is likely to see investors focus on gold prices as well.
Since last week, there were some significant developments in the markets that point to a potential correction in gold prices. On Friday, July 8th, the US nonfarm payrolls report showed that the US economy added 287k jobs beating a conservative estimate and reversing May’s revised jobs of 11k. Then, on Sunday, Japan’s upper house elections saw Shinzo Abe’s Liberal Democratic Party stage a victory, which was being seen as an endorsement of Abenomics. Indeed, Abe was quick to point out to his work, and the latest endorsement is likely to see a lot more Abenomics (read as more stimulus).
In Europe, although there are certain risks from the Italian banking crisis, the current political landscape is expected to see the EU take a softer approach to the crisis in light of the Brexit vote. Meanwhile in the UK, the political uncertainty is showing signs of clearing with the conservative party seeing a leader emerge in the likes of Theresa May, who will be sworn in as the second female Prime Minister of the UK. Reiterating that “Brexit means Brexit” May is being seen as the ideal candidate with the experience to steer the UK out of the EU.

In terms of central bank monetary policies, the US Federal Reserve is pushed on the sidelines until the August FOMC meeting, and the latest jobs report is likely to see the Fed’s concerns ease. Meanwhile, speculation is already rife that the Bank of Japan could expand its QQE purchases when it meets in the last week of July. In Europe, the Bank of England will be in focus this week with expectations that the central bank could come out dovish with economists expecting to see the Old Lady of Threadneedle Street cut rates by 25 basis points at its monetary policy meeting this Thursday.
Taking into account the developments, gold prices remain well supported to the upside on the longer term horizon, and the current declines could be seen in the context of a correction ahead of further gains.
Gold – Technical Outlook
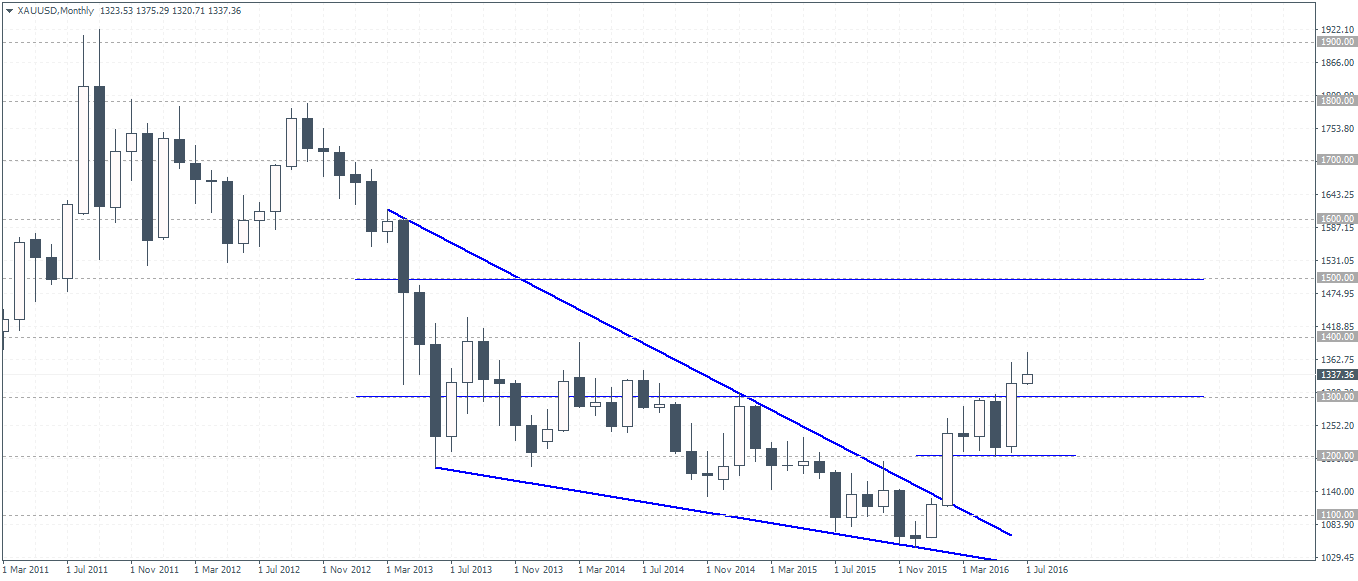
Looking at the monthly chart in gold, we can see that prices have cleared the 1300 psychological price level in June. Currently, we are looking at a pullback following the rally to a 2-year high. Therefore, any declines that come by are likely to be supported near the $1300 level which acted as resistance back in January 2015. A dip to 1300 to establish support could, therefore, see gold establish the floor at 1300 while to the upside, 1400 remains the next level that could be targeted.
On the daily chart, we have three levels of interest, $1350, $1300 and $1250. After the breakout above 1300 on June 24, price action continued higher and stalled a few points above the 1350 level. After staying flat for nearly four days, gold prices extended their declines for two days and broke down below the 1350 level yesterday. Any gains that come by will see a retest to the 1350 level which could be tested for resistance. This leaves the downside target in gold to 1300. The minor dashed median line captures the price action and could confirm the view following a clear break out of the lower median line. In the near term, watch for gold prices to test the 1300 level to establish support.
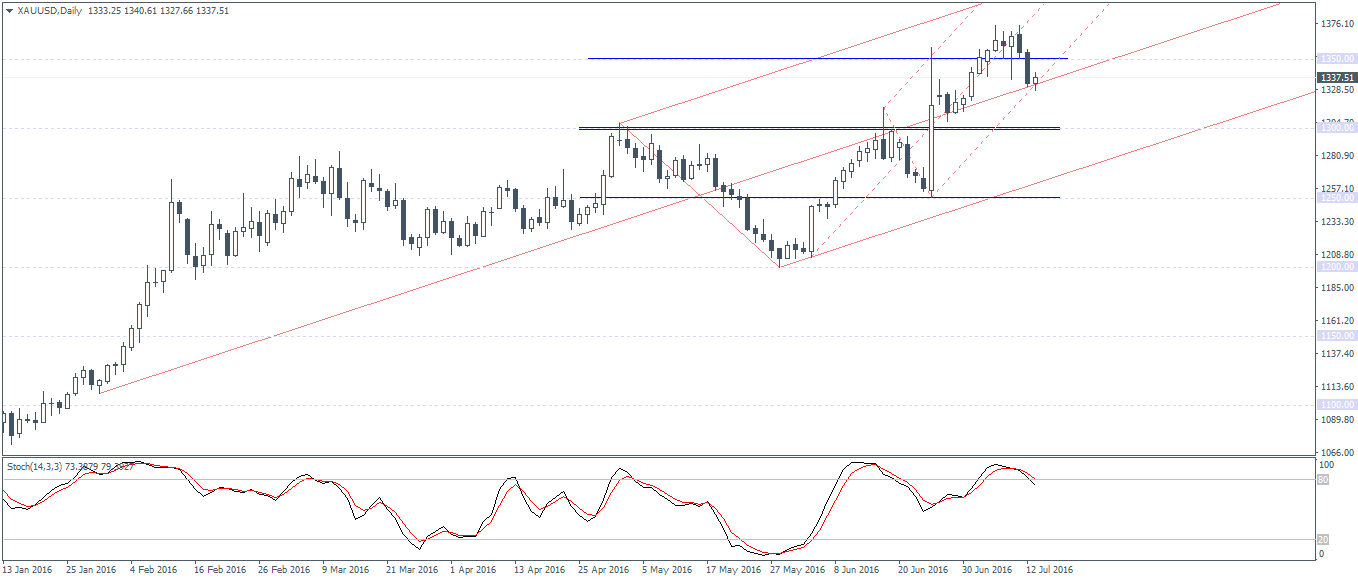
From $1300, gold prices could turn tricky.
To the upside, gold could remain range bound within 1350 and 1300 levels with further gains seen only on a bullish close above 1350. In this event, 1400 comes in as the next main target in focus.
To the downside, a break below 1300 could see prices correct further down to 1250 which makes for a better level to enter to the long side. However, the unfolding price action within 1300 and 1250 will need to be considered.

![Credit Card 160×600 [EN]](https://assets.iorbex.com/blog/wp-content/uploads/2023/06/13144507/Blog-Banner_EN-Banner_160X600X2.webp)