
The precious metal was once again shining following last week’s Brexit referendum vote. Prices in Spot gold briefly touched new 2016 highs of $1358.67 an ounce on June 24, 2016. However, prices retreated sharply off the new yearly highs to settle at $1317.32 an ounce on the day. The following day, spot gold prices remained flat resulting in a doji candlestick pattern, marking indecision following the strong gains. By Tuesday, gold prices extended their declines, closing at $1311.94 an ounce. This minor pullback is being as profit taking following the immediate aftermath of the Brexit outcome.
Although gold prices have retreated following the sharp moves last week, with no clear resolution outlined yet to how the UK and the EU will plan an orderly exit, the uncertainty could keep gold prices supported in the near term.
Last Friday’s Commitment of Traders reports showed an interesting development in the precious metal. The CoT report for the week of June 21st released on Friday 24th June showed that the net speculative long positions rose to 257k contracts, the highest levels ever recorded in the CoT report. The total speculative long positions also jumped to 279k as speculative long positions continued to be built up. However, the CoT report comes ahead of the June 24th referendum vote, and we will have to wait until this Friday to understand how the speculative money was positioned as of June 28th, 2016.
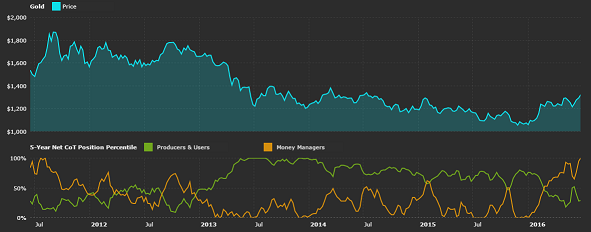

The crowded position in the CoT report indicates to a risk of a liquidation that could potentially put at risk any weak long positions that were formed above the $1300 mark.
Spot Gold – Technical Outlook
From last week’s technical outlook on Gold, we mentioned two potential scenarios. While the basic view was that gold prices were looking weaker below the $1300 handle, we also mentioned an alternate view (keeping the Brexit referendum in mind) pointing out that establishing support at $1260 – $1253 would see further upside.
It turned out that gold prices fell back to the identified support level before breaking above $1300 to post new yearly highs.
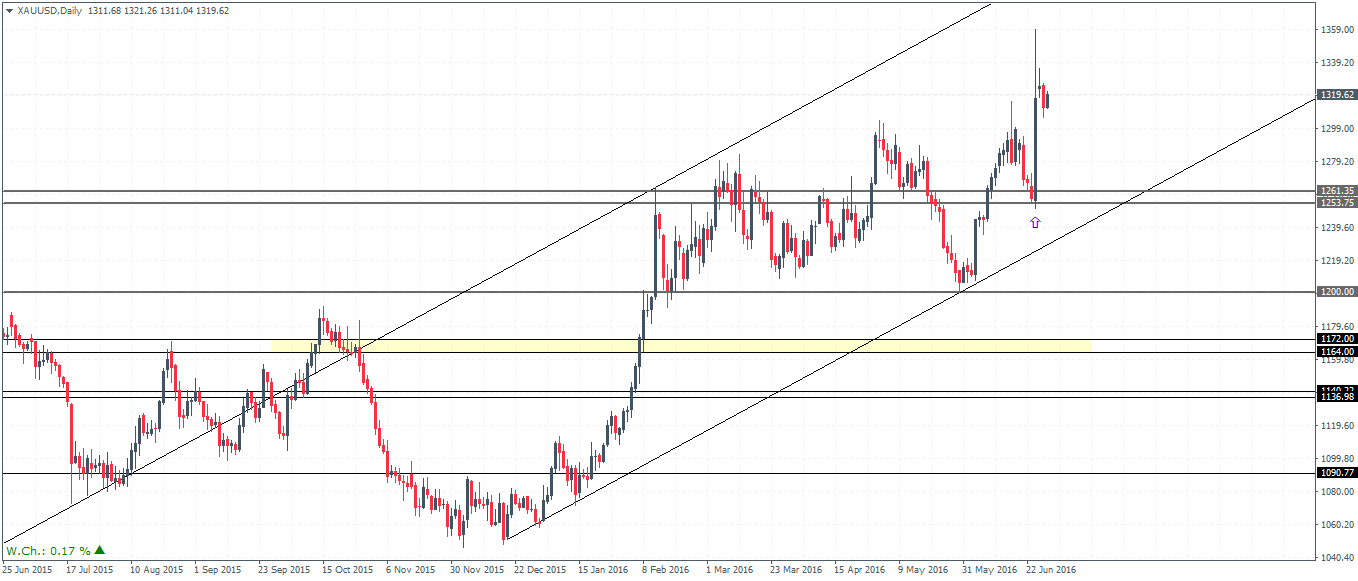
Following the Brexit rally, gold prices saw a pullback to the support at 1299 – 1305. However, given the nature of the retest at this support level and the following strong price rejection, there is scope for another pullback to this level to test the support level more firmly. The technical levels from the daily chart below therefore show that, for further upside in gold, support needs to be formed at 1299 – 1305 for an eventual move to $1350 at the minimum. Alternately, in the event that gold prices fail to establish support at this level, we could expect a steeper decline down to 1260 – 1253 support once again. But also note that supporting the bullish bias is the bullish pennant pattern that has formed, thus confirming the view that the $1300 psychological barrier is very likely to play an important role in the near term direction for gold.
Finally, technical traders should also watch out for the week chart which currently shows price action shaping out to a spinning top pattern and an inside bar as well. This could confirm the view that a bullish close could remain limited within the range established last week.

