
Dollar Index trading at a well-established support level could see a short term shift in sentiment
Summary:
- Markets will be looking ahead to inflation print next week
- Technically, the dollar’s decline is a bit overstretched
- Dollar index at a strong support level showing market indecision pointing to a possible retracement
It has been a wild ride for the US dollar index over the past few weeks. The brief gains made just two weeks ago were overturned following the remarks from Janet Yellen, speaking at the Economic Club of New York. This week, the Fed’s minutes, although expected not to move the markets much given the Fed Chair’s remarks earlier managed to push lower. However, the technical chart for the US dollar index is clearing pointing to a slowdown in the current declines which could risk the short dollar positions.

One of the main themes has been a dovish Fed. Concerns about inflation are not just domestic but also global. The remarks from the Fed Chair showed that the US Federal Reserve would prefer to wait for inflation to gather momentum instead of moving ahead with rate hikes as planned. For the moment, expectations continue to dwindle for a rate hike this year as it is not just about US inflation anymore but the global markets, which could in a way affect the economic progress in the country.
In the next few weeks, the markets will get to see another inflation print for the month of March. While the previous reading showed signs of cooling, a beat on the estimates could bring back bullish sentiment in the markets on the US dollar. This could most likely coincide as technically; the US dollar index is trading at a well-established support level with the price action showing signs of indecision in the markets.
US Dollar Technical Outlook
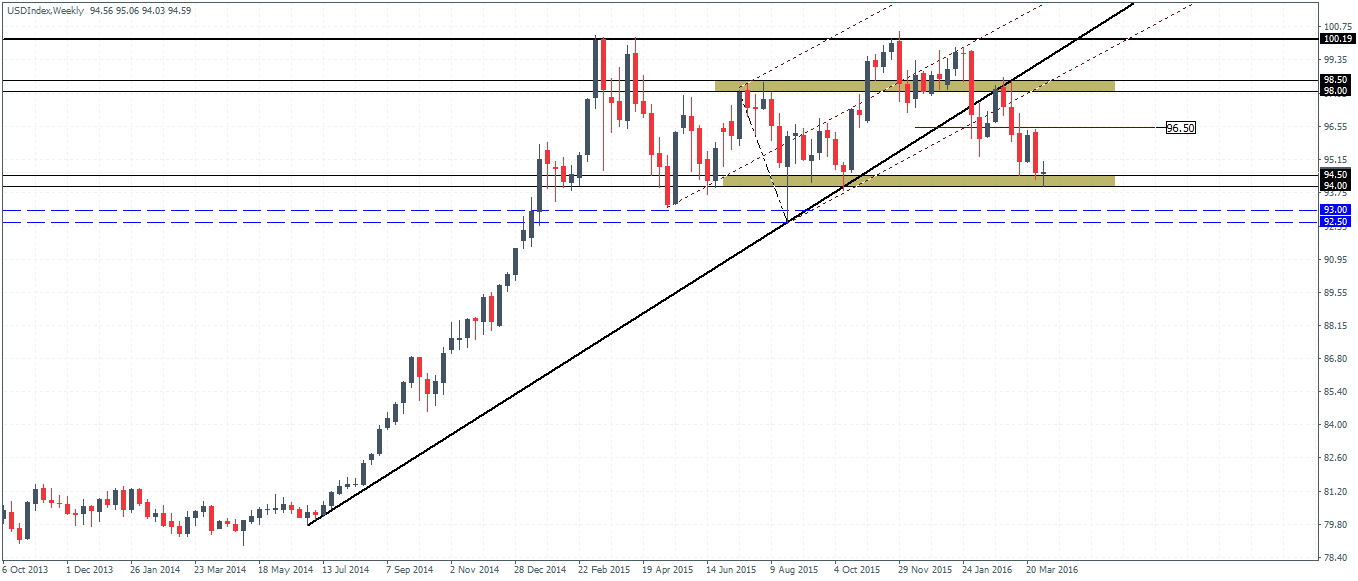
There hasn’t been much happening on the weekly charts, despite the tempting bearish engulfing pattern that was formed last week. With the dollar index near the 94.5 – 94.0 support, a weekly doji close here could signal a change in momentum with prices likely to retrace some of the losses over the past couple of weeks. Resistance at 96.50 from the weekly chart is the first level of interest.
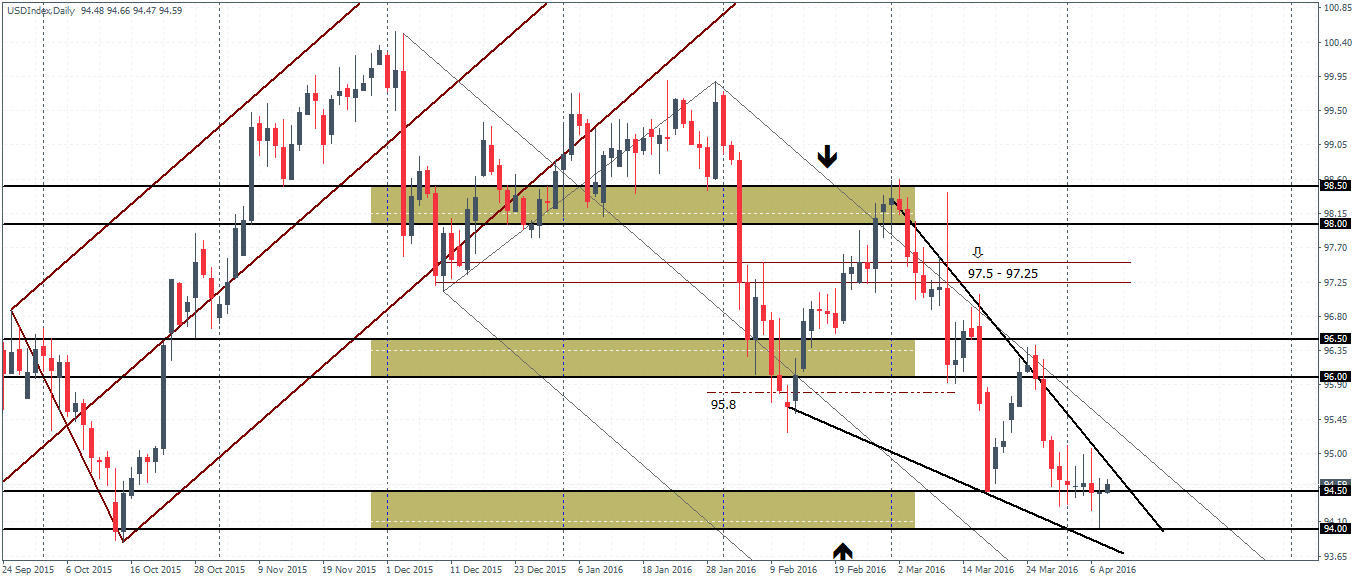
The daily chart shows the US dollar index trading within a falling wedge pattern. Price action has stalled near the support level of 94.5 – 94.0 and the past couple of daily sessions have closed with a doji pattern. Reversal which could be confirmed by prices closing bullishly above 94.0 and a breakout from the falling wedge will be the first indication of a move to the upside. Watch the 96.0 – 96.5 level of resistance which could hold the rally in the first instance.
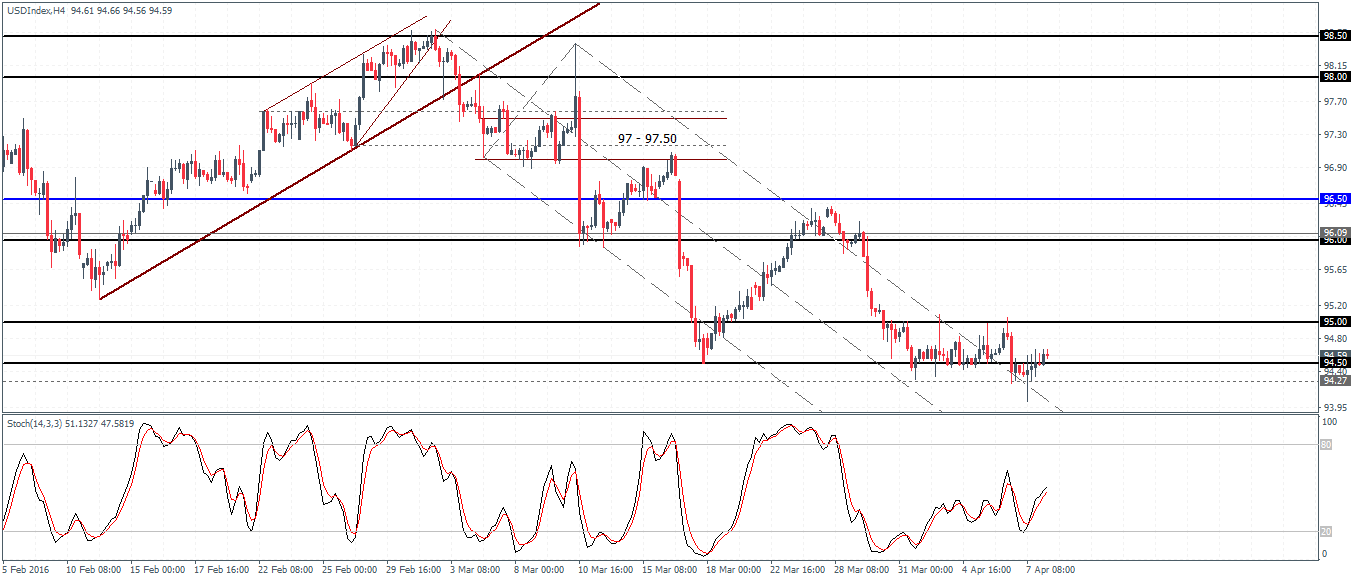
The 4-hour chart on the US dollar index shows a strong bullish divergence forming with the Stochastics forming a higher lower against the lower low in prices. The divergence points to a correction towards 96 and eventually to 97.0 – 97.50 if the resistance levels give way. Currently, prices are flat, but a breakout higher and a subsequent higher low in the dollar index will give the added confirmation for a move higher.
To conclude, while the dollar index does pose a risk of a correction, the bias could be invalidated should we see a weekly close below the 96.0 handle. In this case, the momentum could see a pickup as it could spell further downside in the Greenback.

