
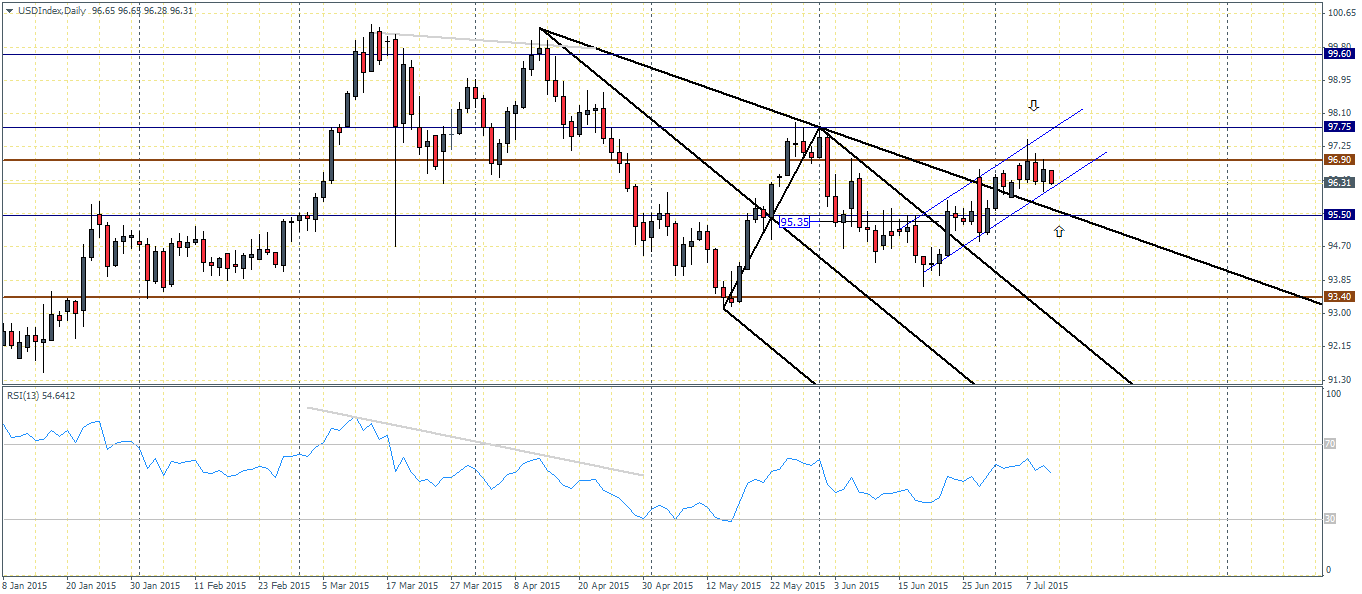
The US Dollar Index has been trading sideways for the past 5 sessions on the daily charts, indicating that a possible break out that is imminent. At the first glance, the US Dollar Index looks biased to the downside, but we need to see a break down from the rising price channel in order to ascertain the bias. As of now, resistance comes in at 97.75 while support lies at 95.5.
Price needs to close above 96.90 on the daily charts in order to validate the upside bias. This is based on the fact that after the divergence that was formed between the peaks near 100 and 99.8, a short term support was established near 96.90. This level is now currently acting as resistance. Therefore, should prices fail to break above 96.9 resistance, we could expect to see some declines in the US Dollar Index.
Switching to the H4 chart time frame, we notice that the US Dollar Index is currently consolidating within a large rising wedge/triangle pattern and we notice price currently attempting to break out to the downside. We need to see a more clear validation of the downside bias, preferably with a retest back to the break out level, near 96.55 region of support/resistance. Should this pattern be established, then we can expect the US Dollar Index to break down with an initial support offered near 95.85 – 95.6 region. A close below this level will then see prices test the next main support at 95.02.Any dips within the ascending triangle could see support near 95.85 – 95.6 region, which also shows confluence with the rising trend line (which forms the triangle).


Fundamentally, there weren’t much of major market moving events this week, with most of the price action being derived from the Eurozone Greece debt crisis. Because the Euro weighs heavily in the trade weighted index, any possible shifts in the price action in the Euro is very likely to affect the sentiment in the US Dollar Index and this is largely one of the reasons why we notice the sideways range in the US Dollar Index, which is similar to what the EURUSD has been experiencing.
FOMC minutes from the June meeting did not reveal much for the markets. However it is clear that there are increasing doubts about the Fed hiking rates this year. Last month’s NFP report wasn’t stellar, although it was considered to be above average. For the past two weeks, the weekly unemployment claims have risen more than expected as well and the onus would be on the upcoming weekly unemployment claims that could shed more light into the health of the US labour markets.
Today’s main risk comes from Fed Chair, Janet Yellen’s speech later in the evening, but it is unlikely that we will get to see anything much. The markets head into another weekend of uncertainty surrounding the Greece debt crisis and one that could continue to keep the pressure on the US Dollar Index.
In Summary:
- Price action on the daily charts has been trading sideways and is pointing to a potential break out in the near term
- The H4 charts shows price currently attempting to break lower from the wedge/triangle consolidation pattern
- We need to see a clear retest of the break out near the 96.55 region to ascertain the validity
- To the downside, support comes in at 95.85 – 95.6 level which could offer some kind of bounce
- The next support is at 95, should 95.6 give way
- To the upside, a close above 96.55 is needed to bring back the bullish bias

