
Gold futures were down this week, trading -1.25% lower since Monday’s open. Prices fell sharply as Gold tested the lows of 1150. The drop in prices comes despite the geo-political uncertainty surrounding Greece and its debt crisis. With the monthly candlestick charts printing a bearish engulfing pattern, Gold prices are likely to decline in the near term with the eventual support on the monthly charts coming in between 1170 – 1082.
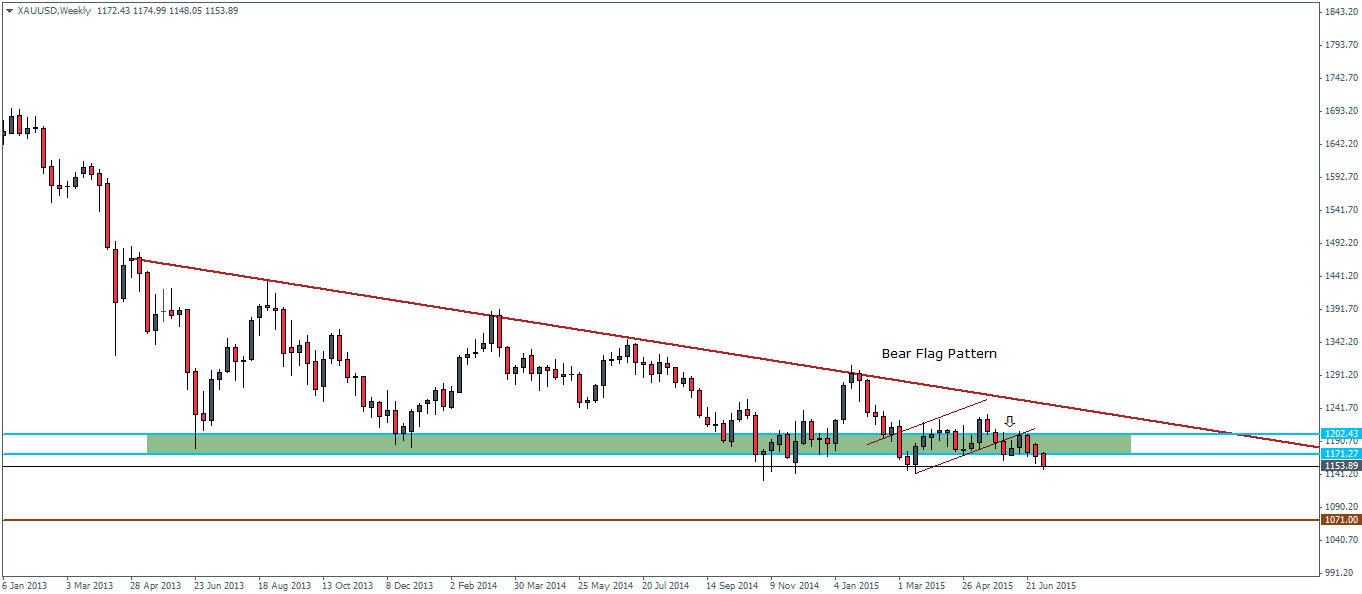
Switching to the weekly charts, price action is starting to move out from the major support level between 1202 – 1171. A weekly close below 1171 could signal the start of a new leg in the downtrend, albeit there is a risk of a possible retest to 1171 to test the broken support for resistance.
The bearish flag on the weekly charts points to a conservative measured target to 1071, which shows a confluence with the monthly support zone as well.

On the 4-hour chart for Gold, price action cleared the 1165.44 level of support/resistance after prices saw a bounce off this level previously. The test to 1174.25 saw a sharp rejection sending prices lower. We suspect that there is a possibility of another test to 1165.44 – 1174.25 region before the decline continues. As of now, price looks to be forming a falling wedge pattern which is indicative of a potential break out to the upside.
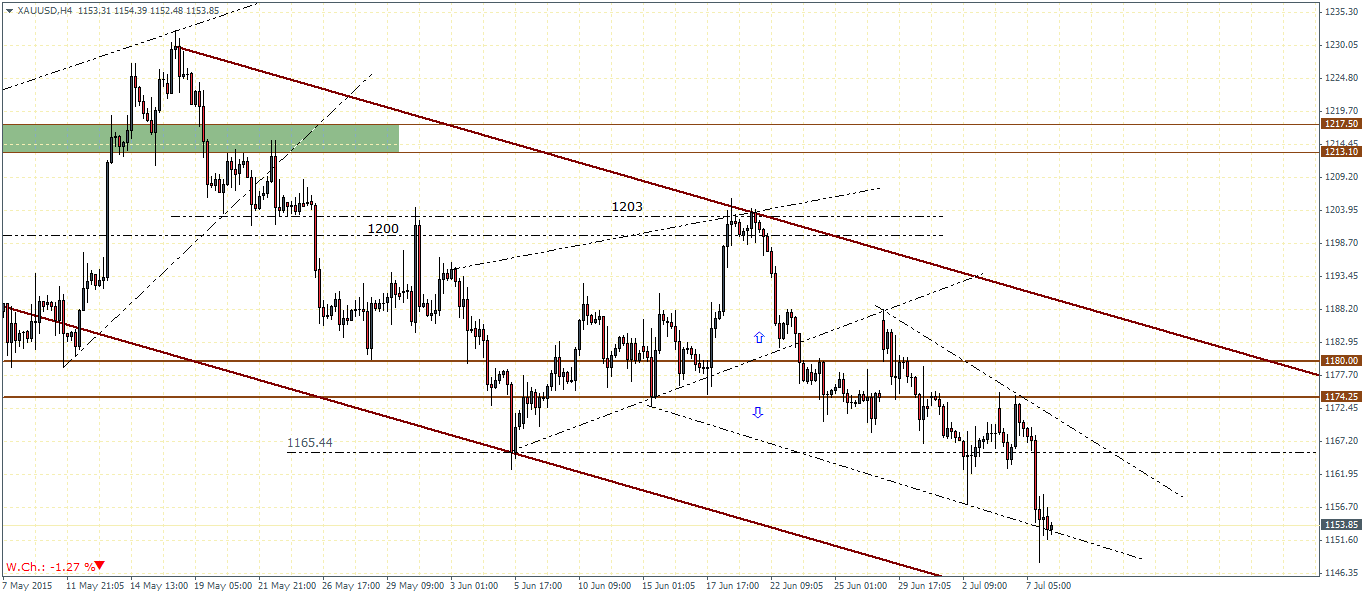
As such, we look for a possible test of resistance near 1165.44 region in the event of a break out from the falling wedge pattern, while to the downside a close below the recent lows near 1150 will indicate a continued downside in price action.
Silver prices have also declined this week. However, the lows in Silver are not being confirmed by the RSI, which is printing higher highs. This divergence is indicative of a possible corrective rally to the upside. On the weekly charts, support/resistance comes in at 15.58, which will be the first level to clear. A successful break of 15.58 resistance and a test of support could see Silver prices test as high as 18.73 in the medium to long term time frame.
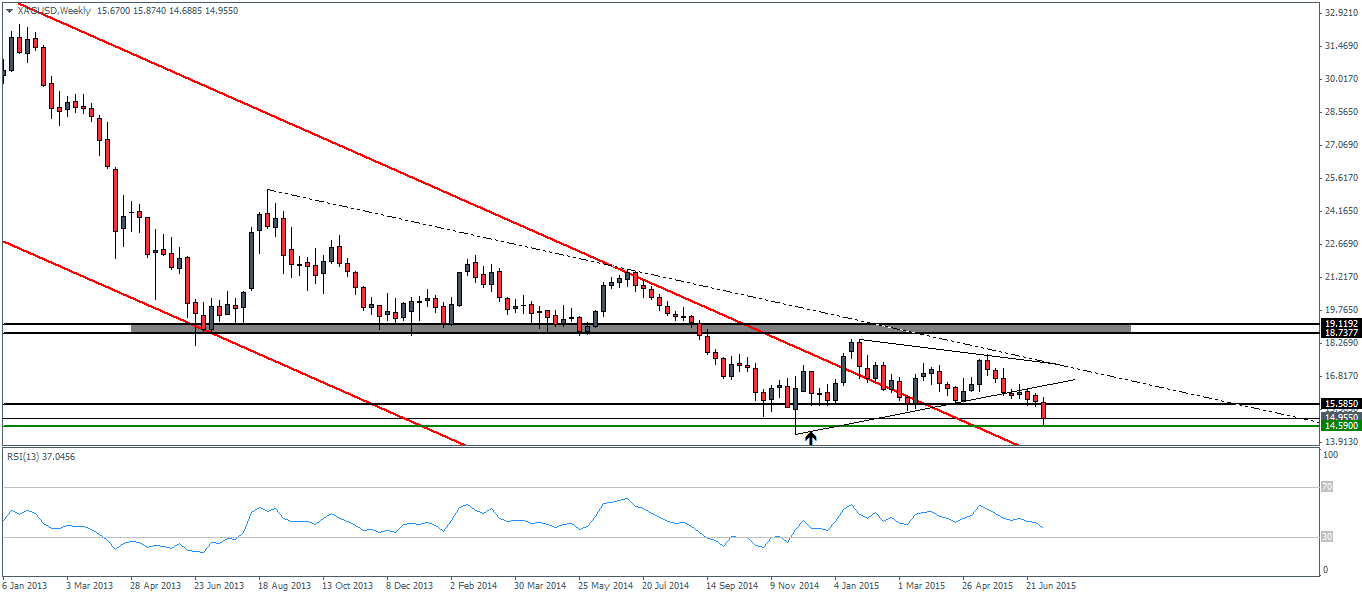
For the week, Silver prices lost close to -4.8% as prices touched a fresh yearly lows at 14.81. On the weekly chart, price is still trading within the falling price channel and the most recent decline shows confluence with the lower rails of the price channel, indicating rejection of prices at this level. The support at 14.95 incidentally was previously tested in late November 2014 and marks a test of this support level for a second time in years.
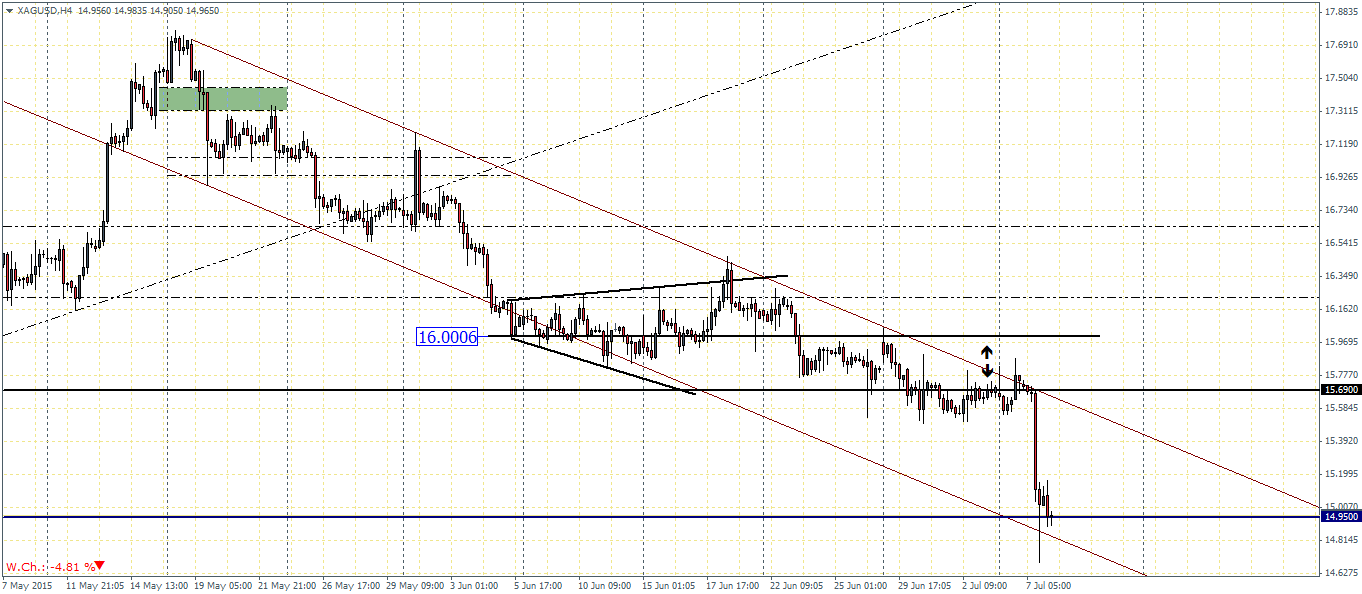
In the near term, we expect to see some bounce taking place from the current levels of support with 15.58 – 15.7 region being the most likely level of resistance to be tested in the near term. Depending on how price reacts at this level at 15.7, we can then ascertain the future course of direction in Silver futures.

