Weekly Forex Technical Outlook – 25th May
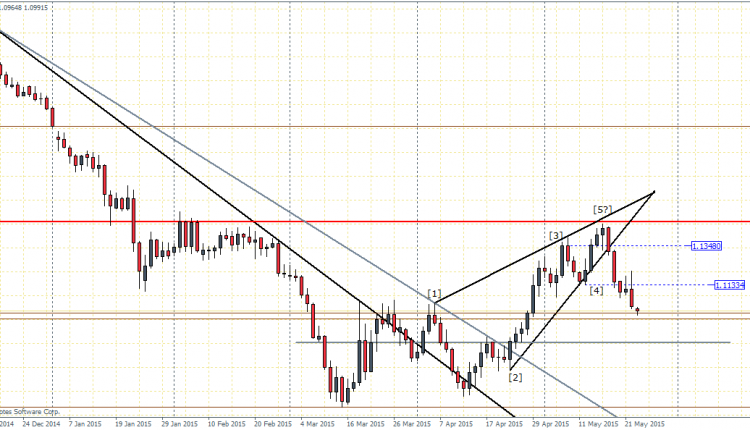
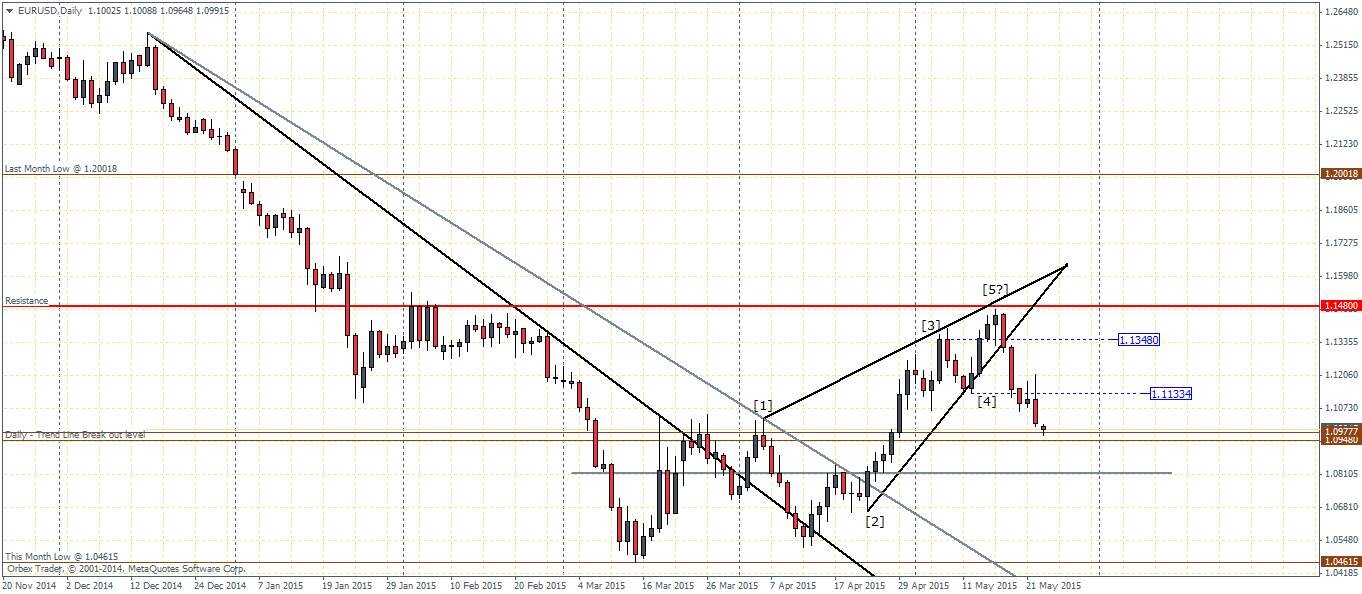
EURUSD (1.0994): The rising wedge/triangle pattern broke out with price failing to properly test the resistance at 1.148, which could be a potential target to the upside should prices rally. The breakout from the triangle was based on a strong bearish engulfing pattern last week with little to no retest of the breakout near 1.1348. The following decline was sharp last week with strong bearish candlesticks forming the majority over the week. Price is now back to 1.0948, which marks the break out of the original trend line (black). However, plotting a new trend line to fit the trend more accurately, we also get a second break out level near 1.0816, which is likely to be the next destination should the declines continue this week.
From 1.0816 (or at 1.0948), EURUSD needs to be monitored as there is a very thin line dividing the bullish rally from the bearish continuation of the trend. If prices are supported between 1.0948 – 1.0816, we could expect EURUSD’s rally to target 1.1348 and even to 1.1480.
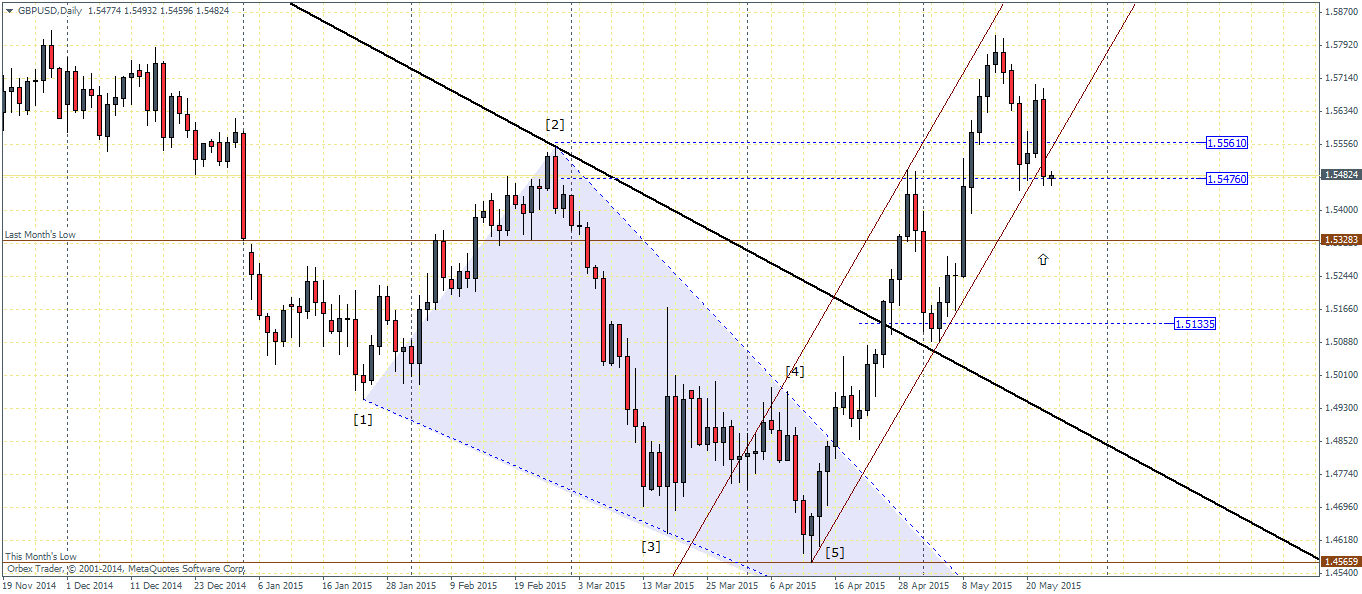
GBPUSD (1.5485): Price managed to find support between 1.5561 through 1.5476 which saw GBPUSD try to rally but failed to break higher. This followed a strong bearish candlestick that resulted in price ending back into the support zone. At pixel time, price action is trading at 1.5476. If this level holds, we could expect GBPUSD to push higher, while a break below 1.5476 will see GBPUSD test 1.5328. The fact that price action is trading outside the rising price channel is something to bear in mind.

Keep an eye out for possible bullish reversal at current levels.
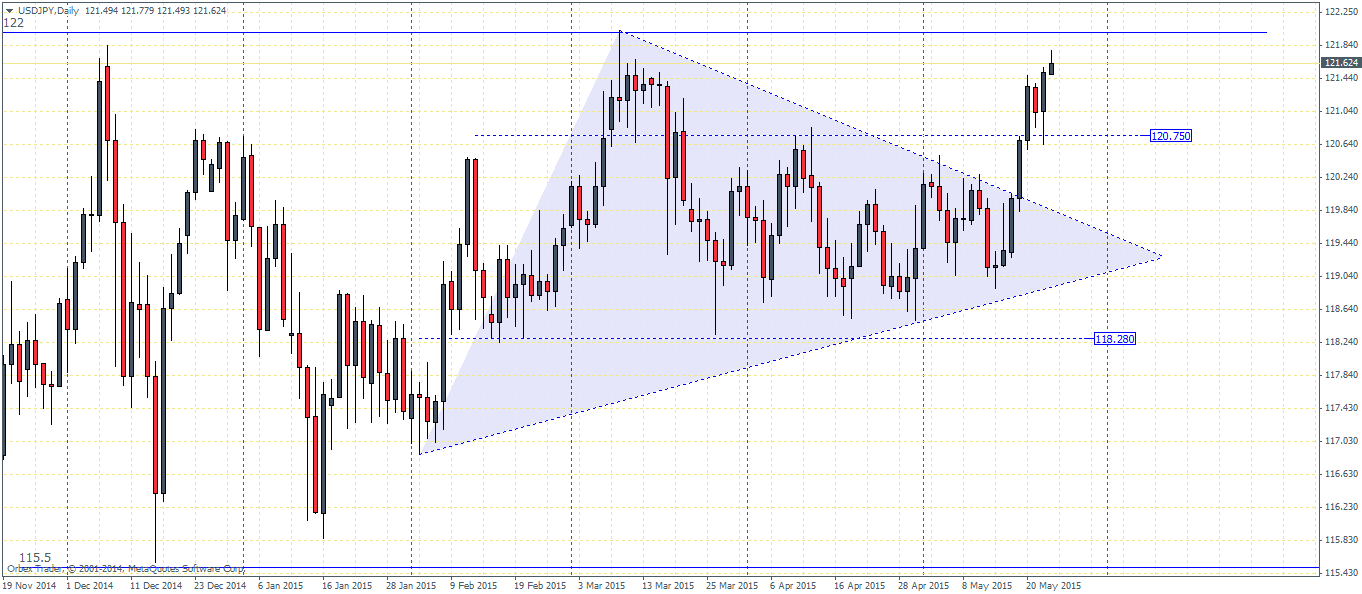
USDJPY (121.6): The almost symmetrical triangle pattern saw a breakout last week with price briefly retesting 120.75. The next target for USDJPY is the 122 price level. A break above 122 is required to expect further gains possibly with 122 turning to support. In the unlikely event that price fails to rally, 120.75 support could be tested, preferably with a close at these levels. Regardless, 120.75 forms the line in the sand, which if holds out as support could propel USDJPY higher. If 120.75 fails as support, we could assume that the upside rally in USDJPY was a fake out and wait for further confirmation from price.
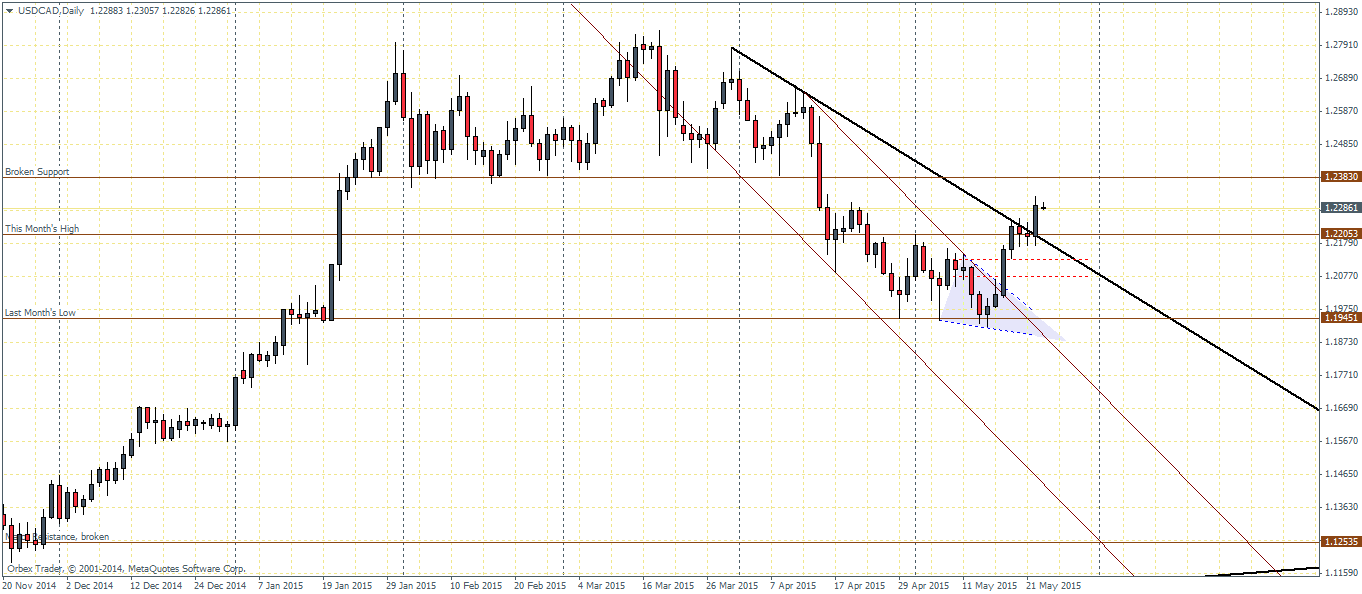
USDCAD (1.2285): USDCAD saw a very nice reaction to the trend line with two bearish days followed by a strong break out. We expect a possibility of a test to 1.2205 for test of support before price can extend its rally to 1.2383 and beyond. There is also a possibility that USDCAD could push towards 1.2383 without retesting the break out level which could give us an early indication that prices could fall back to 1.22. Below 1.22, the next support comes in at 1.2077.

![Credit Card 160×600 [EN]](https://assets.iorbex.com/blog/wp-content/uploads/2023/06/13144507/Blog-Banner_EN-Banner_160X600X2.webp)