Weekly Forex Technical Outlook – 18th May
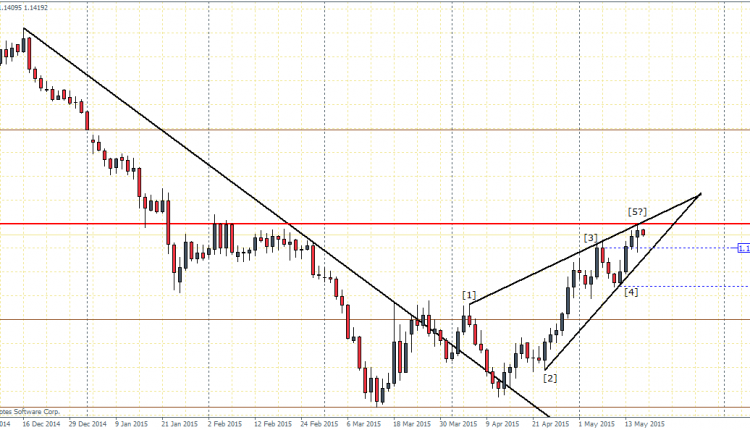
EURUSD (1.1421): On the weekly charts, price action showed last week closing on a bullish note following the previous week of indecision. Price opened this month below last month’s low at 1.20018 and gapped down while the current month looks to have formed a low at 1.04615.
After breaking out of the trend line connecting the highs of 16th December 14 and 26th February 15, we get the break out level at 1.0948. There was no retest to this level as price initially broke out only to dip back lower before finding support at the trend line but managing to make a higher low around 9th April 2015.
Resistance is identified at 1.148, where we saw price stalling at this level for three days in a row in early February this year. After the break out, price has been moving into a consolidation pattern, forming a rising wedge/triangle formation, making alternate contact points. So far, the high made was at 1.1466 on last Friday, 15th May. We could therefore expect to see a push higher towards 1.1480, which could potentially mark the test to resistance at 1.148 and also marks the completion of the rising wedge pattern.
1.1348 will be a level to keep an eye out as a close below this level could start a correction to this surprise rally and could spell a decline towards 1.11334 and eventually to 1.0948.

Alternatively, if price breaks above 1.14800, a test of support could be quickly established which would then see the EURUSD test the previous unfilled gap towards 1.20018.
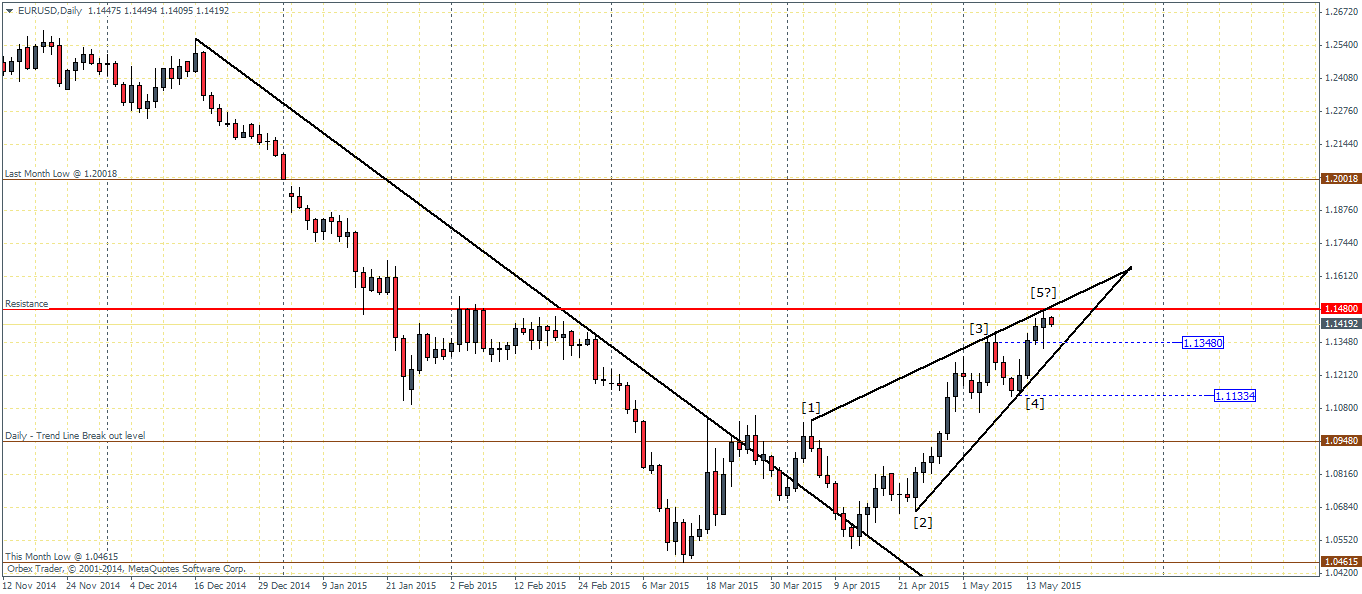
From the above, we can conclude that for the medium term, we have seen a bottom in the EURUSD with 1.0948 being a level to watch as a break lower could see the downtrend being resumed.
GBPUSD (1.569): From the weekly charts, GBPUSD saw a bullish close last week as price spiked towards 1.5814 before easing lower. On the daily charts, we notice a bearish engulfing candlestick being formed. If we see today’s close to be lower, we could expect a minimum correction to 1.5478.
Connecting the trend line on the daily charts, between the highs of 15th July 2014 and 26th February 2015, we notice a break out near 1.5134 around 24th of April followed by a quick retest to this level on 4th of May. Price saw a quick rally on a bullish engulfing candle at this break out level.
Prior to the trend line break out, price action entered into a consolidation pattern, forming a falling wedge which validated the pattern by breaking out higher.
We can see the support/resistance level between 1.5561 and 1.5476, which is where we expect the current decline to stall towards in order to establish support.
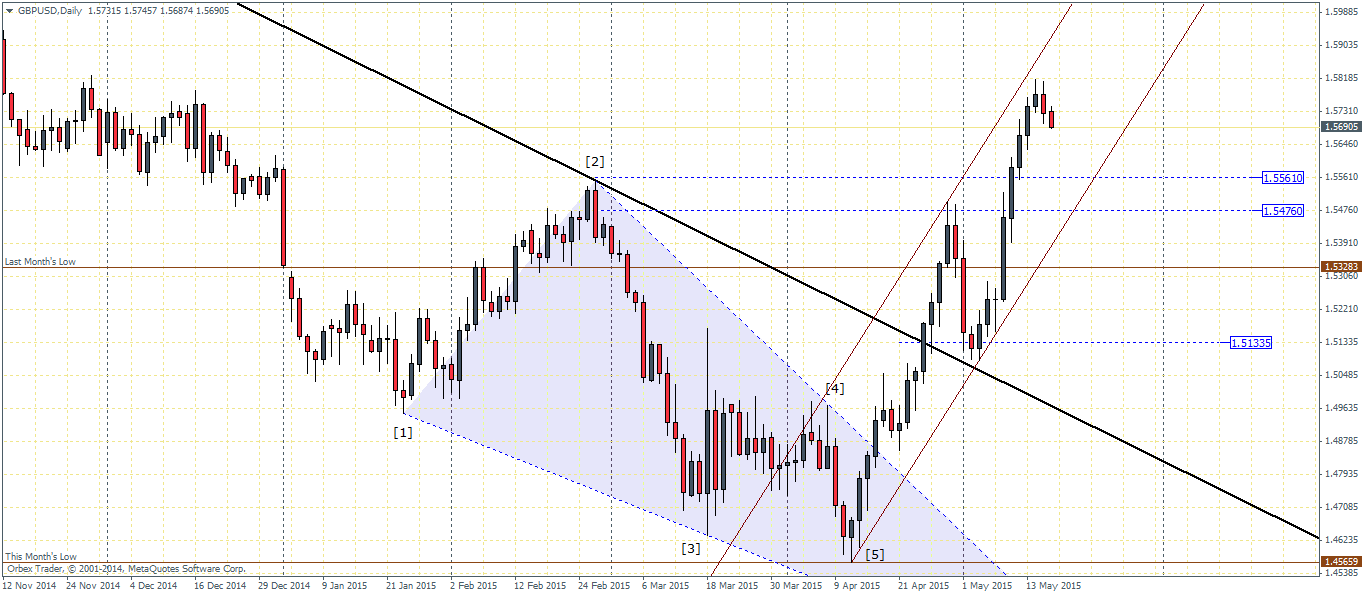
A break below 1.5476 will see price target 1.53823, last month’s low and perhaps towards 1.51335, the trend line break out. The bias for a correction to 1.5561 – 1.5476 is supported by the steep rising price channel where price just zoomed out from the level without proper test of support or resistance.
From the above, we can therefore conclude that based on the bearish engulfing candle on the daily charts, GBPUSD will likely dip lower to 1.5561 – 1.5476.
USDJPY (119.58): USDJPY has been moving in a sideways range for the past couple of weeks, with the range high/lows set to 122 and 115.5. Switching to the daily chart time frame, we notice the consolidation pattern forming into an almost symmetrical triangle, which could spell a break out in any direction. Within the daily time frame, we get 120.75 and 118.28 as the short term highs and lows of the range.
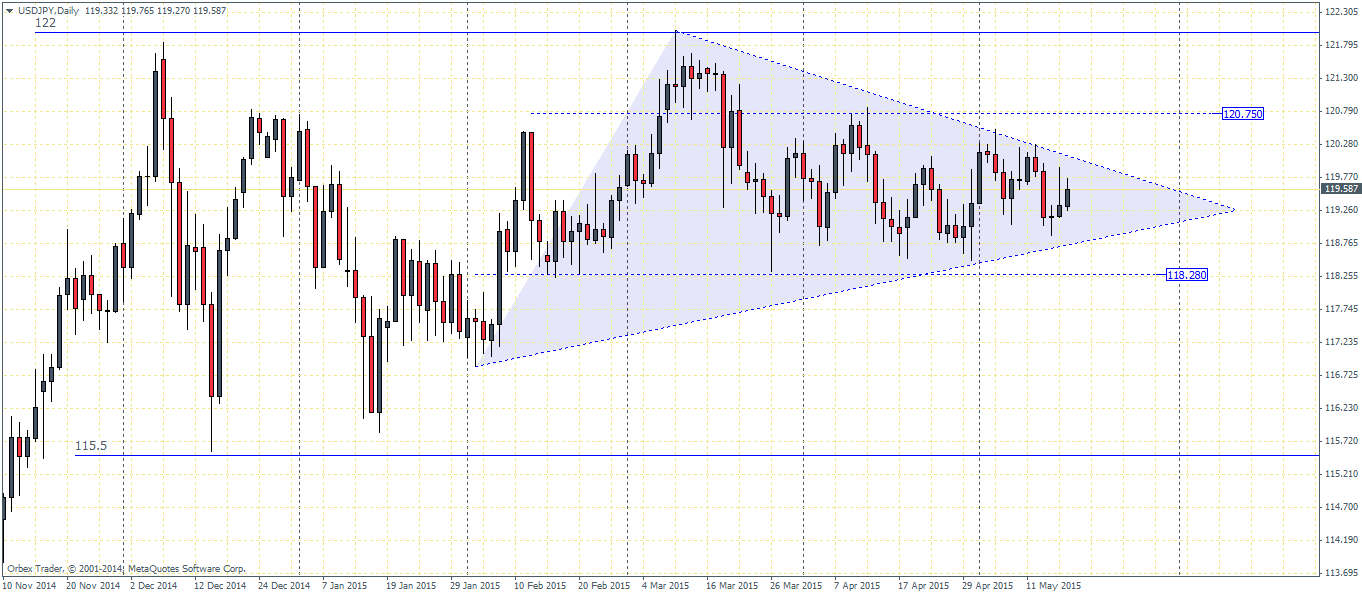
Thursday’s daily candlestick closed in a doji followed by a modestly higher Friday’s close. This indicates that we could see a potential test to 119.99. A daily close above this level could see a test to 120.75. Alternately, a close below 119.070 will see USDJPY dipping lower to 118.28.
USDCAD (1.2029): After finding resistance at 1.27495, USDCAD has formed multiple bearish engulfing candlesticks on the weekly chart and has thus declined lower on breaking the near term support at 1.23755. On the daily charts, after cutting across the support at 1.2383 with a bearish candlestick on 15th April 2014, price formed a monthly low at 1.19451. Price action this month has seen a dip to last month’s low but formed a fairly acceptable piercing line candlestick on Thursday and has edged higher on Friday. Today’s bullish close will confirm a move to the upside.
A break above this month’s high at 1.22053 is required to anticipate further moves to the upside. There is also the risk of the falling trend line acting as resistance to this move.
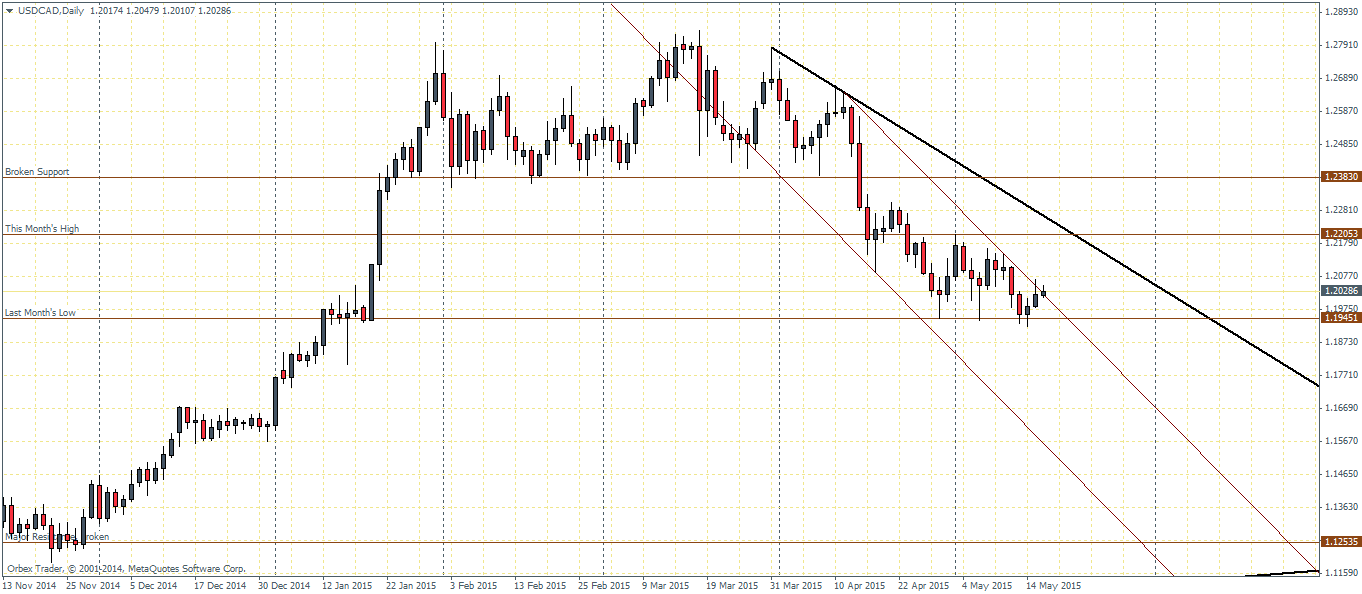
Plotting a falling price channel, if price action manages to close outside the channel today, we could expect a test to 1.22053
From the above, we can conclude that a test to 1.22053 is on the cards and price action from here on will prove critical. Failure to break above 1.22053 will see a further continuation in the declines, with the immediate target at 1.19451, last month’s low and perhaps even lower with an eye to the major broken resistance at 1.12535 which could be tested for support.

