
Despite starting the week on a shaky note, the US Dollar Index managed to kick start its rally making fresh 5 year highs. The Index closed yesterday at 89 but remains short of the major resistance level at 89.17, which if the general theme continues could be seen today. The Greenback has managed to continue to keep its gains despite a broadly mixed economic data that was released in the past week, hinting that the US economy is growing at a moderate pace with diminishing headwinds.
The Fed’s Beige book data which was released yesterday shows that employment has been picking up across the board based on data collected up to November 24th, last week. The outlook on the employment from the Fed comes just a day ahead of the all important monthly jobs data, which is expected to rise 230k, softly lower than previous month’s expectations of 235k.
Since our update last week, the Dollar Index saw a very modest correction after declining for 3 consecutive days from the highs of 88.45 only to regain its bullish momentum. As noted in many of our past Dollar Index analysis, the major resistance level to battle is at 89.17 or 89.20 rounded off. The Dollar Index reached this level back in February 2009 and retreated. The fact that this resistance level was tested only once so far after being established in 2009 is indicative that unless we see a solid jobs report this Friday, the Dollar Index could likely struggle with the resistance level.
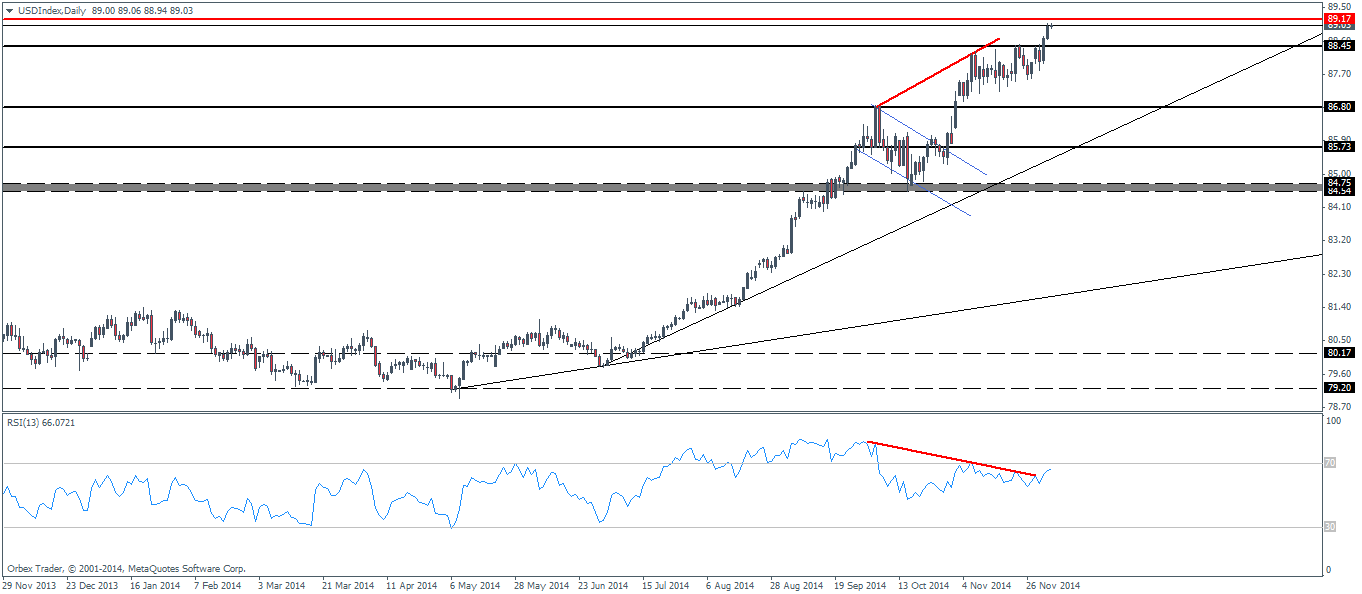

We also notice the growing bearish divergence being formed as the Dollar Index continues to make new highs while the RSI has eased off from the lows. However, typical for such behavior, we will need to see a close below the short term support levels near 88.45 in order to expect a decent correction down to 86.8 or 85.73 levels.
From the 4-hour charts, we can see that the Dollar index has managed to broaden its upward price channel having broken out from the horizontal resistance near 88.25. But again, in order to see a continuation of the rally, price often drops back to test the broken resistance for support, which in this case is yet to happen.
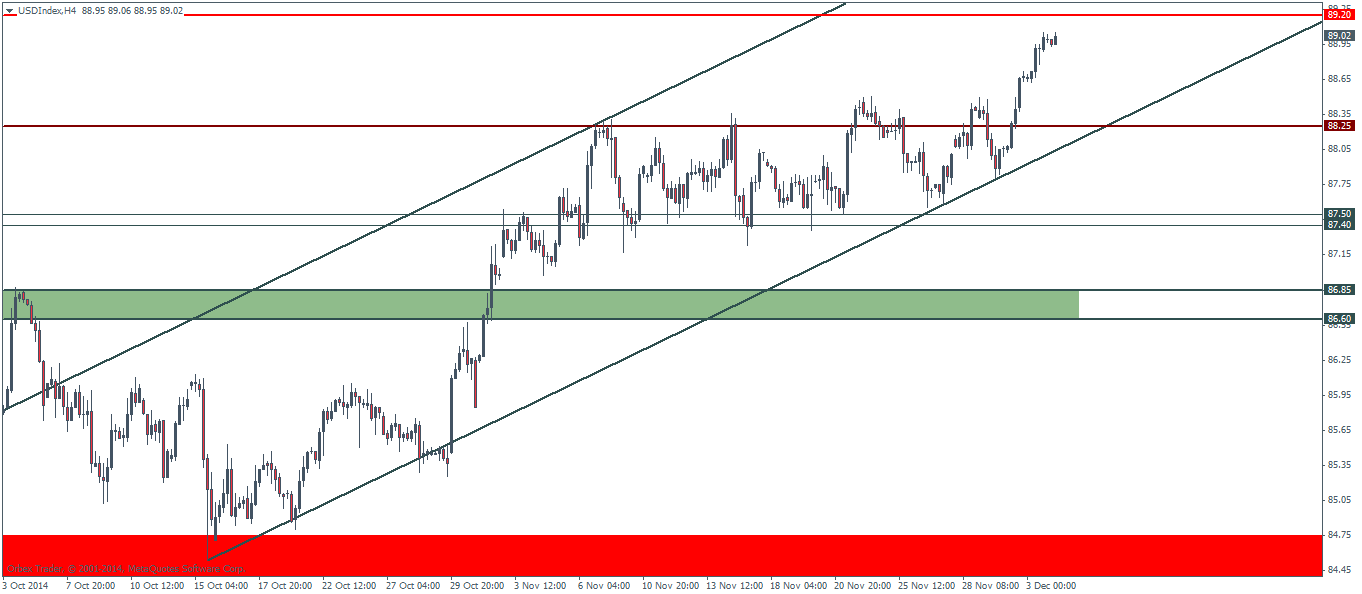
Given the current circumstances and the technical charts, it is very likely that if we see a rally to 89.20, the Dollar Index could potentially pave way for a decline down to the broken resistance at 88.25 before we can expect to see a further continuation. For the correction pointed out in the daily charts based on the bearish divergence, we will need to see a breakdown of the 4-hour chart price channel and preferably a close below 88.25 in order to see a corrective decline to the region of 86.8.
With the above technical set up, it brings to the front the question of “when” rather than if as the price action above dictates a very certain correction in the Greenback that is yet to come. If the above technical analysis for the Dollar Index does indeed play out as expected, we could see a minor rally especially from subdued currencies such as the British Sterling which has been very resilient to the Greenback’s rally.

