



NZDUSD regains confidence
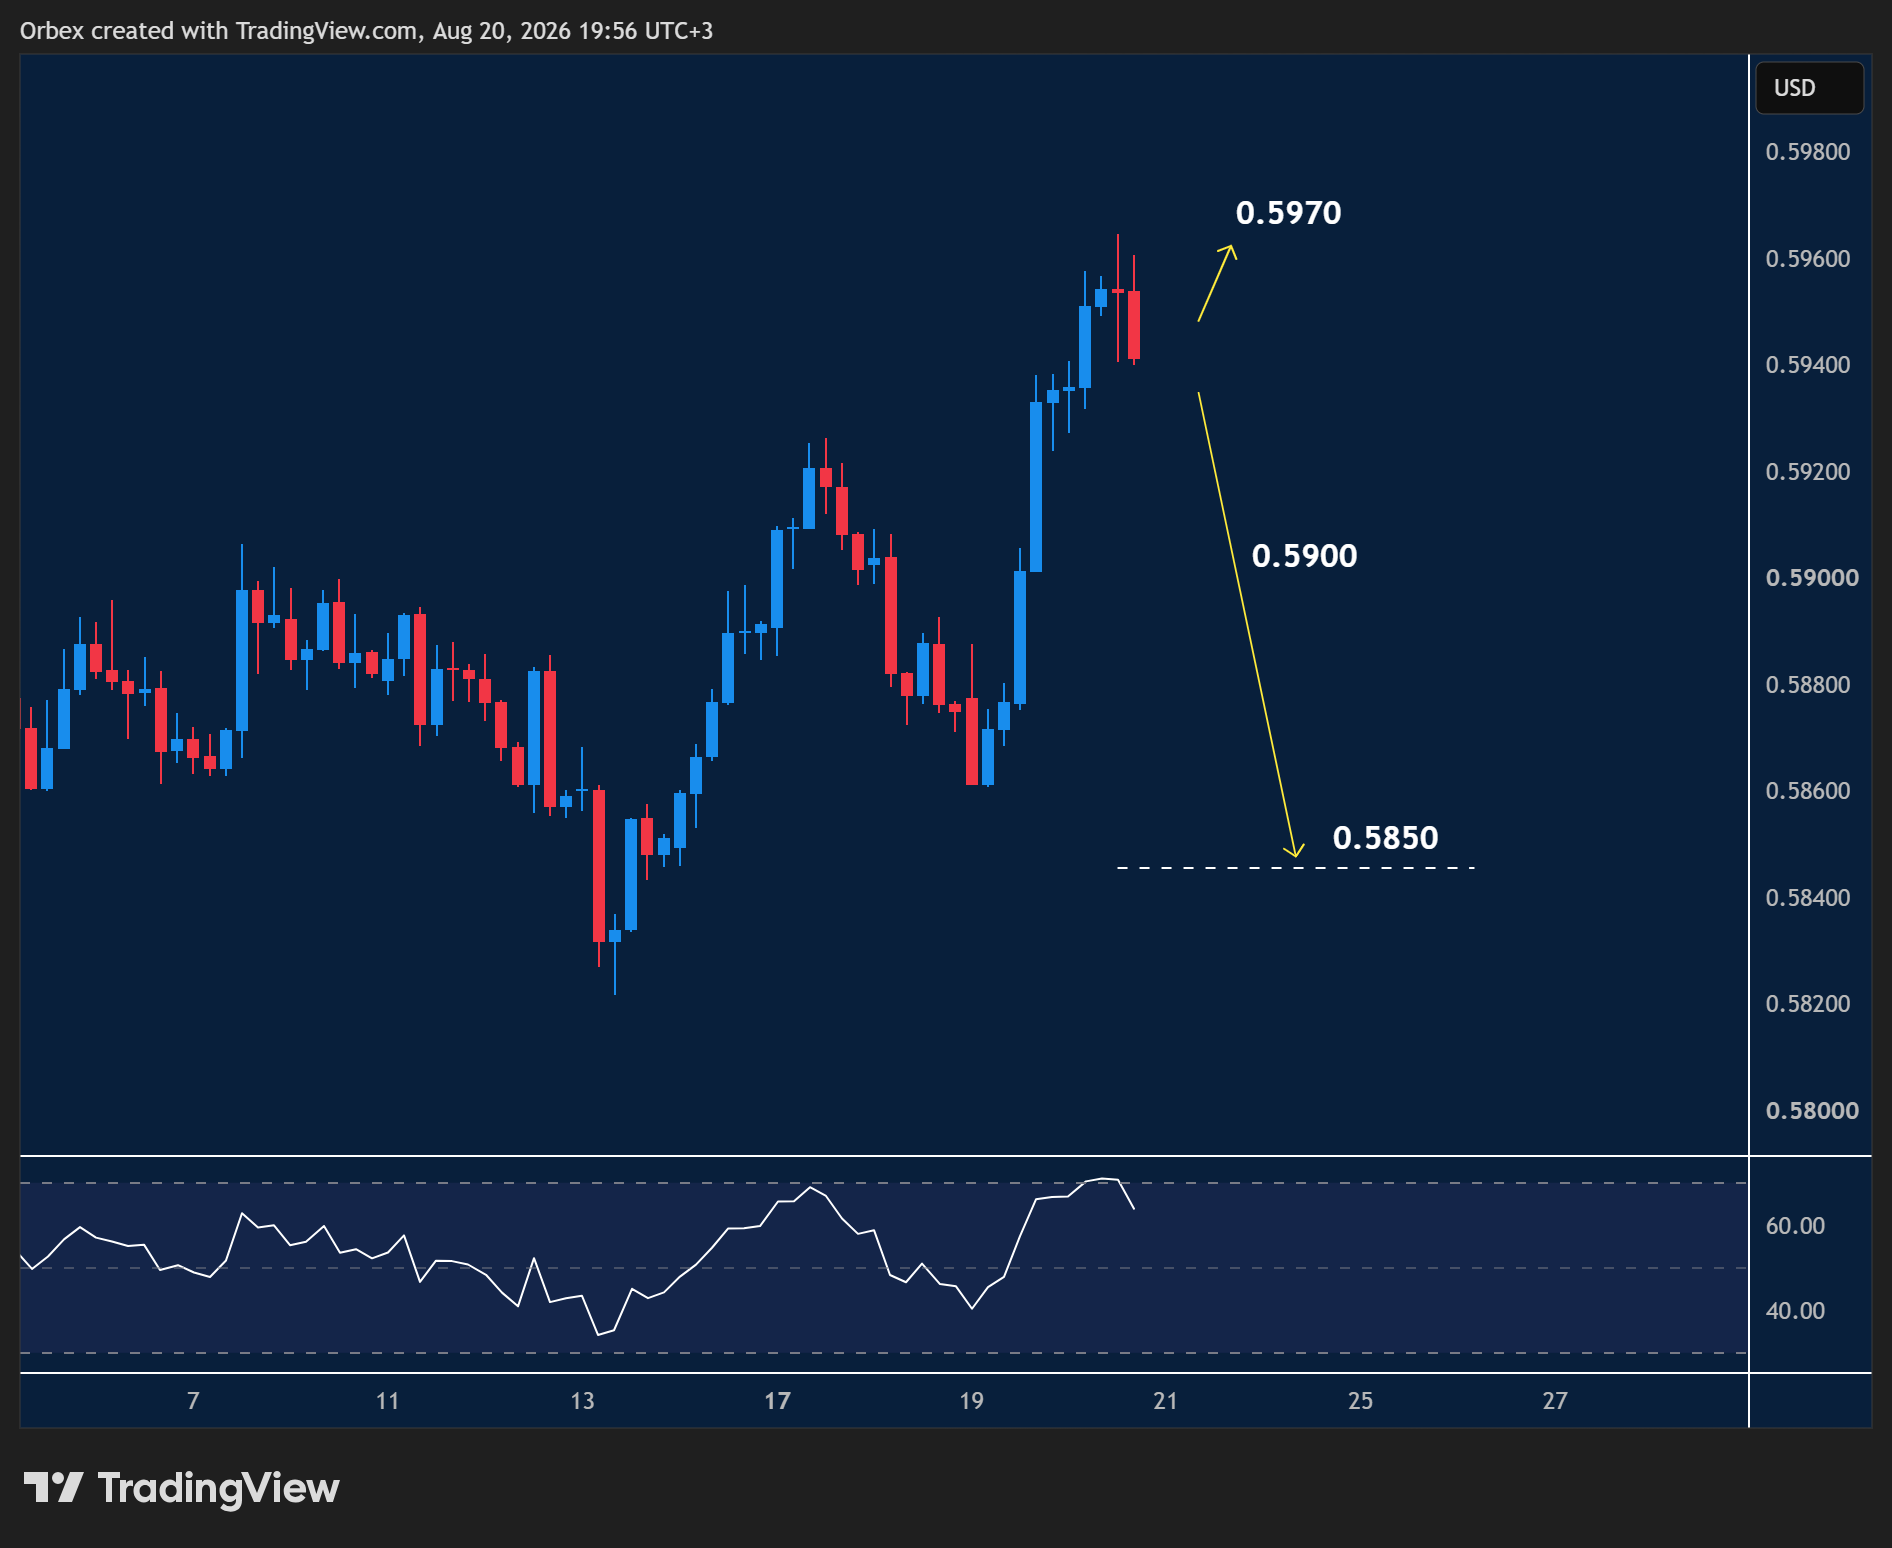
The Kiwi took a slight breather after moving over 100 pips higher as the bullish influence remains.
- A rally towards the mid-0.5900 area has prompted sellers to trim their exposure.
- After a brief consolidation, 0.5970 is the key level to overcome before the pair can break free of its corrective path.
- An extension can open the door to 0.6050 at the previous high.
- 0.5900 is a critical support to prevent the pair from hitting fresh lows towards 0.5850.

EURGBP hits critical floor
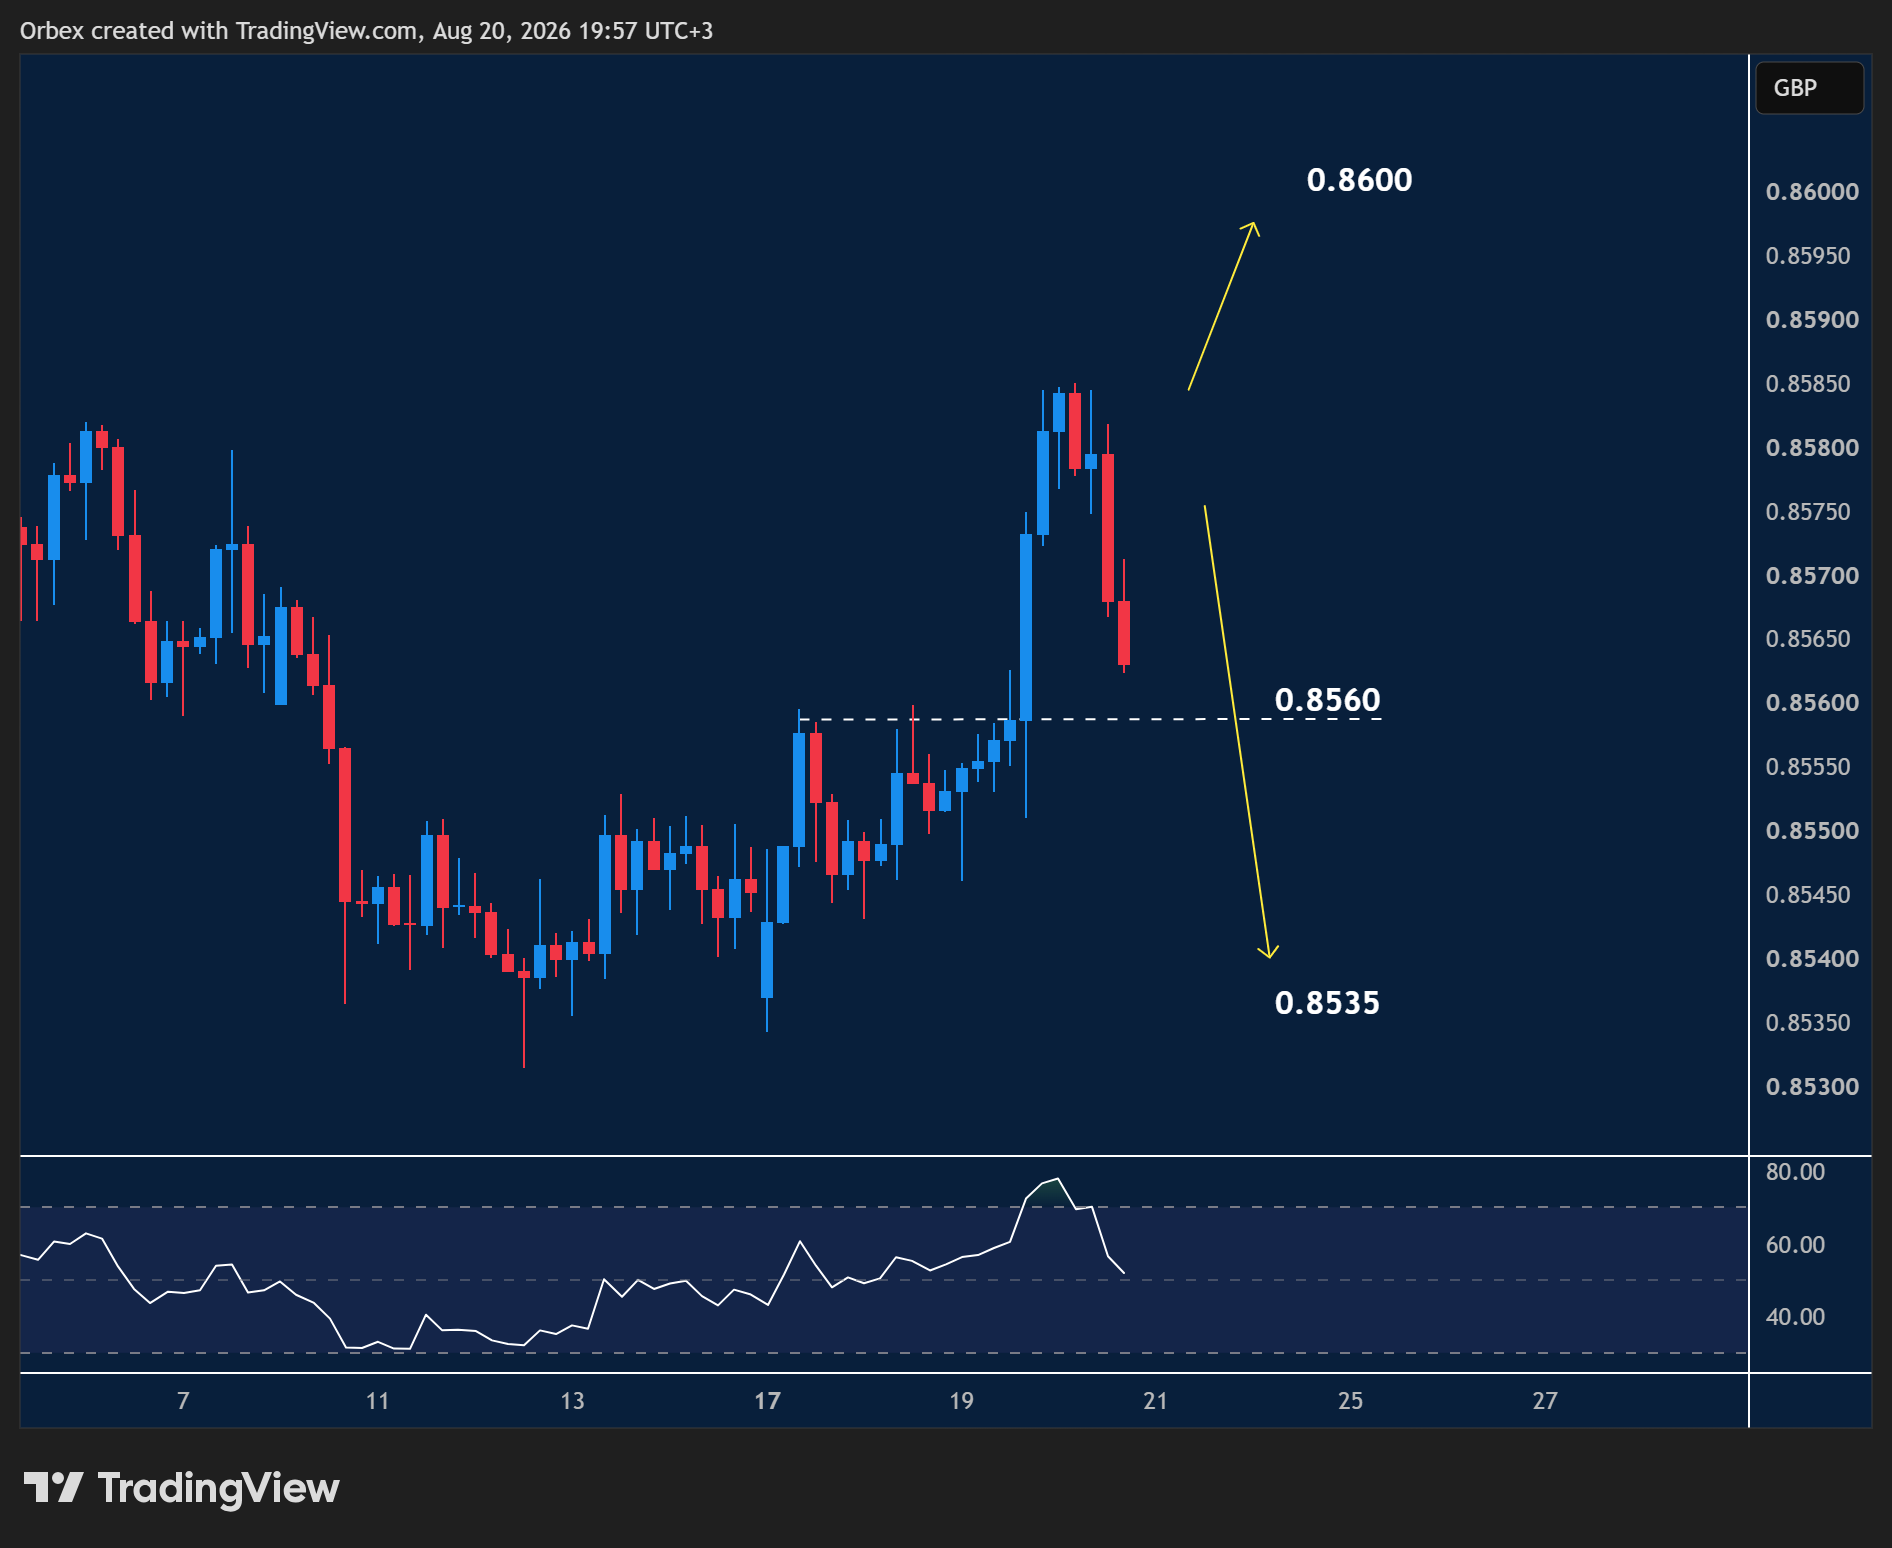
The Euro pulls back to test a critical double top, leading to a fall below 0.8580.
- The bearish pattern has continued to force some buyers to bail out.
- A revisit of this month’s low below 0.8560 would show a lack of commitment from bulls.
- As the RSI moves into the neutral zone, buyers will need to clear 0.8585 before regaining control.
- Otherwise, a bearish continuation would extend losses towards 0.8535.
US 500 probes support
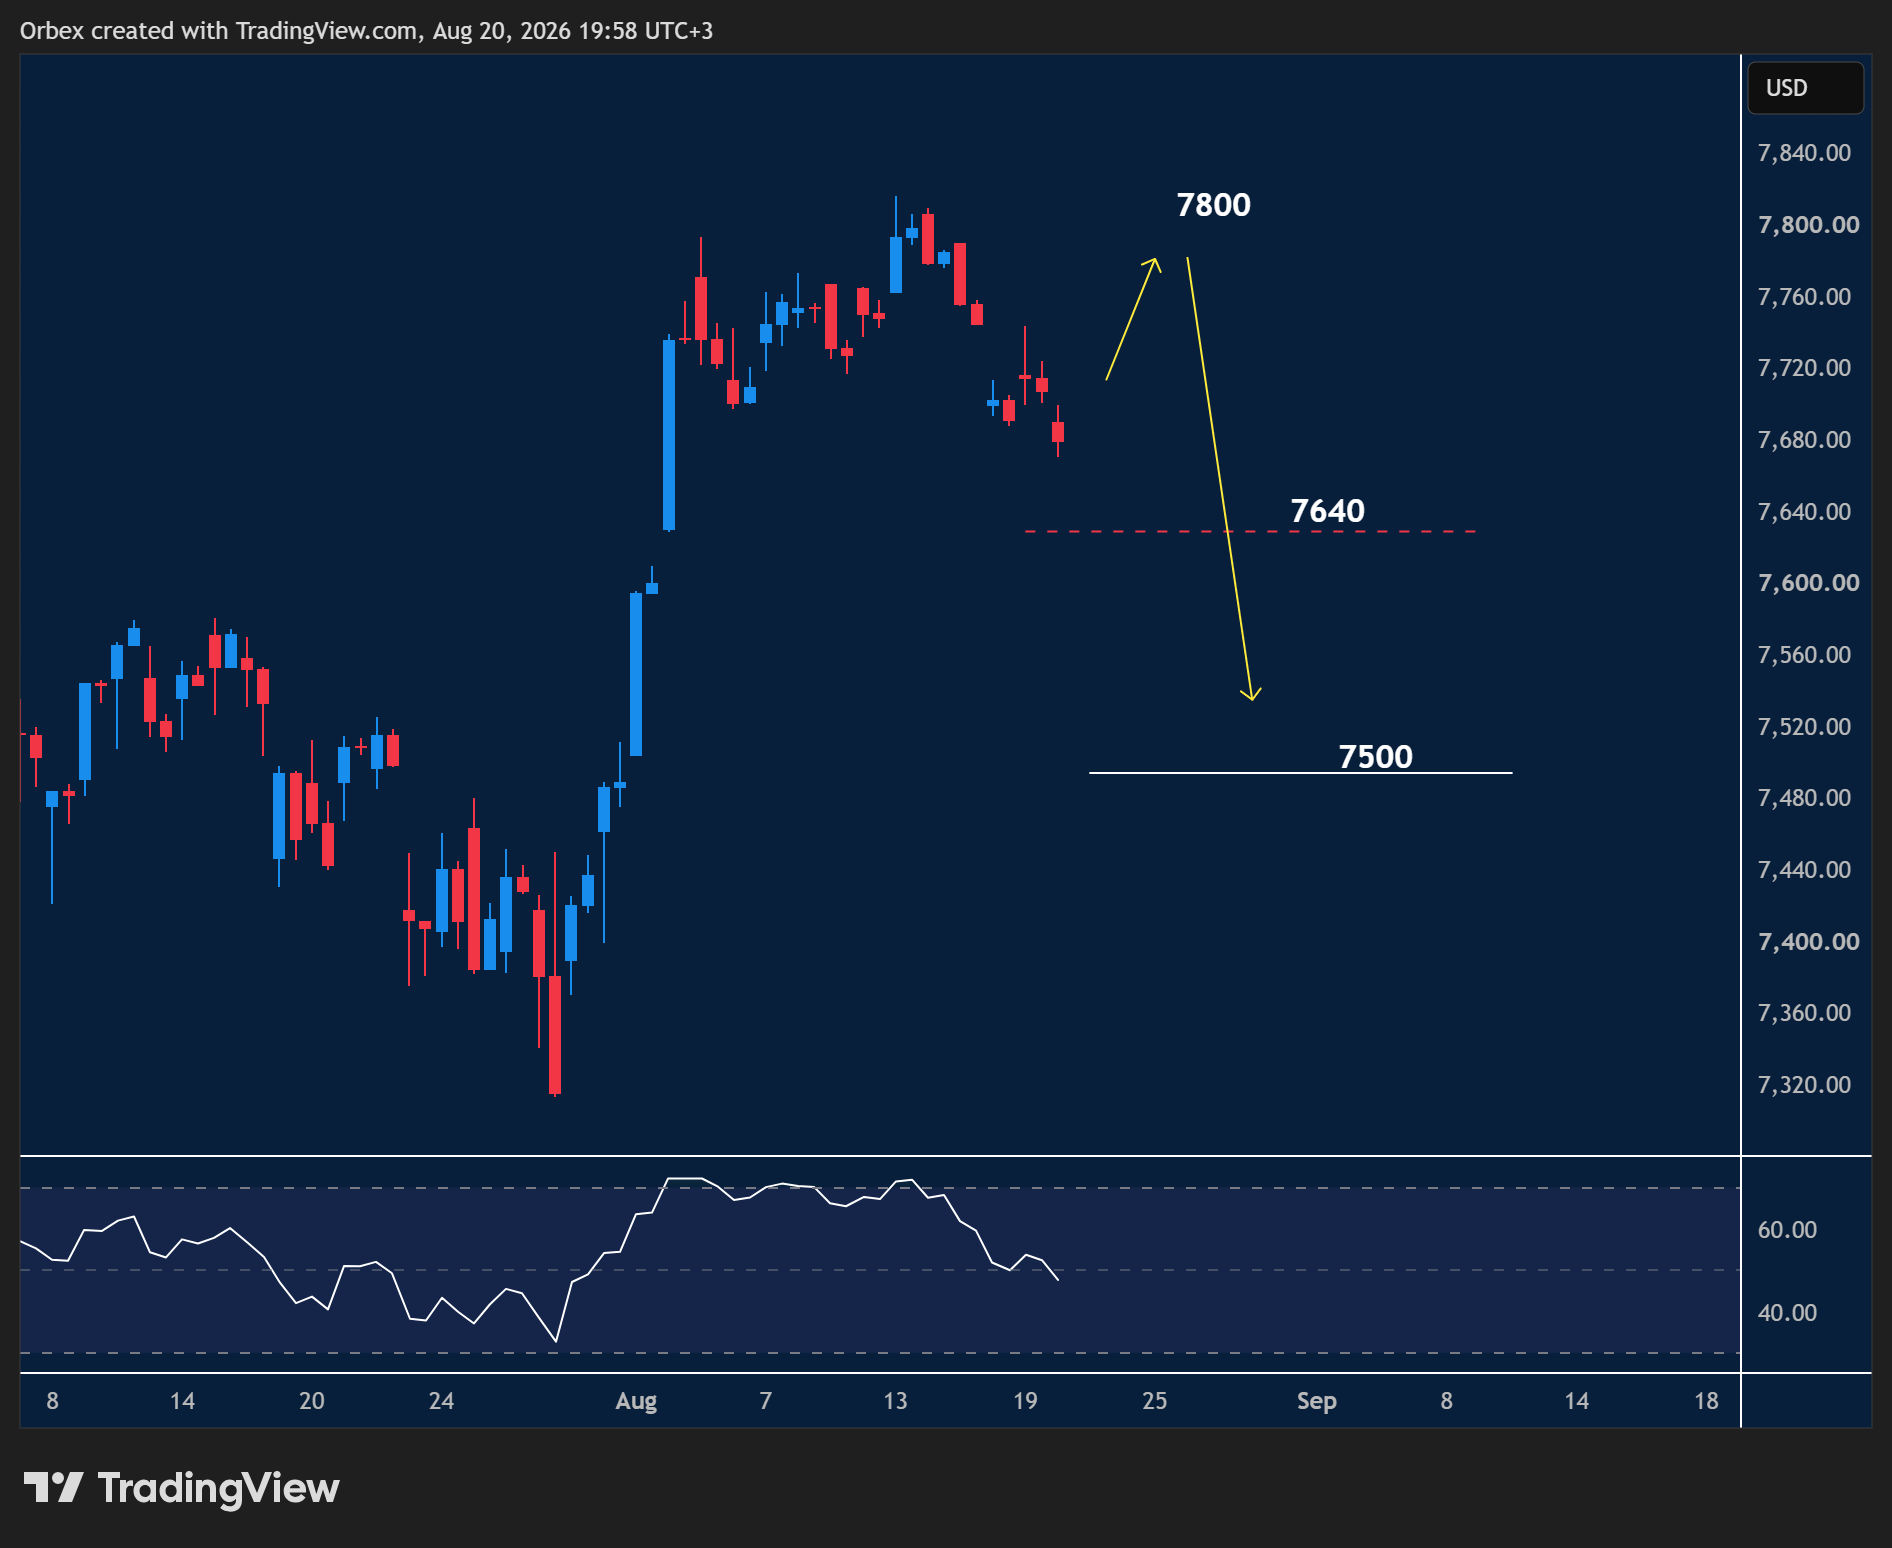
The S&P(US 500)moves towards another fresh low as the stock market continues to decline.
- While a move towards 7800 would support a bullish trajectory, the latest downturn signals exhaustion.
- A reversal continues as short-term buyers take profit.
- As the RSI falls away from the overbought zone, this could indicate an opportunity for buyers to step in.
- 7640 is the next support, whilst 7500 is a critical floor should the sell-off continue.
Trading the forex market requires extensive research, and that’s what we do best



![Credit Card 160×600 [EN]](https://assets.iorbex.com/blog/wp-content/uploads/2023/06/13144507/Blog-Banner_EN-Banner_160X600X2.webp)


