



USDCAD hits major resistance
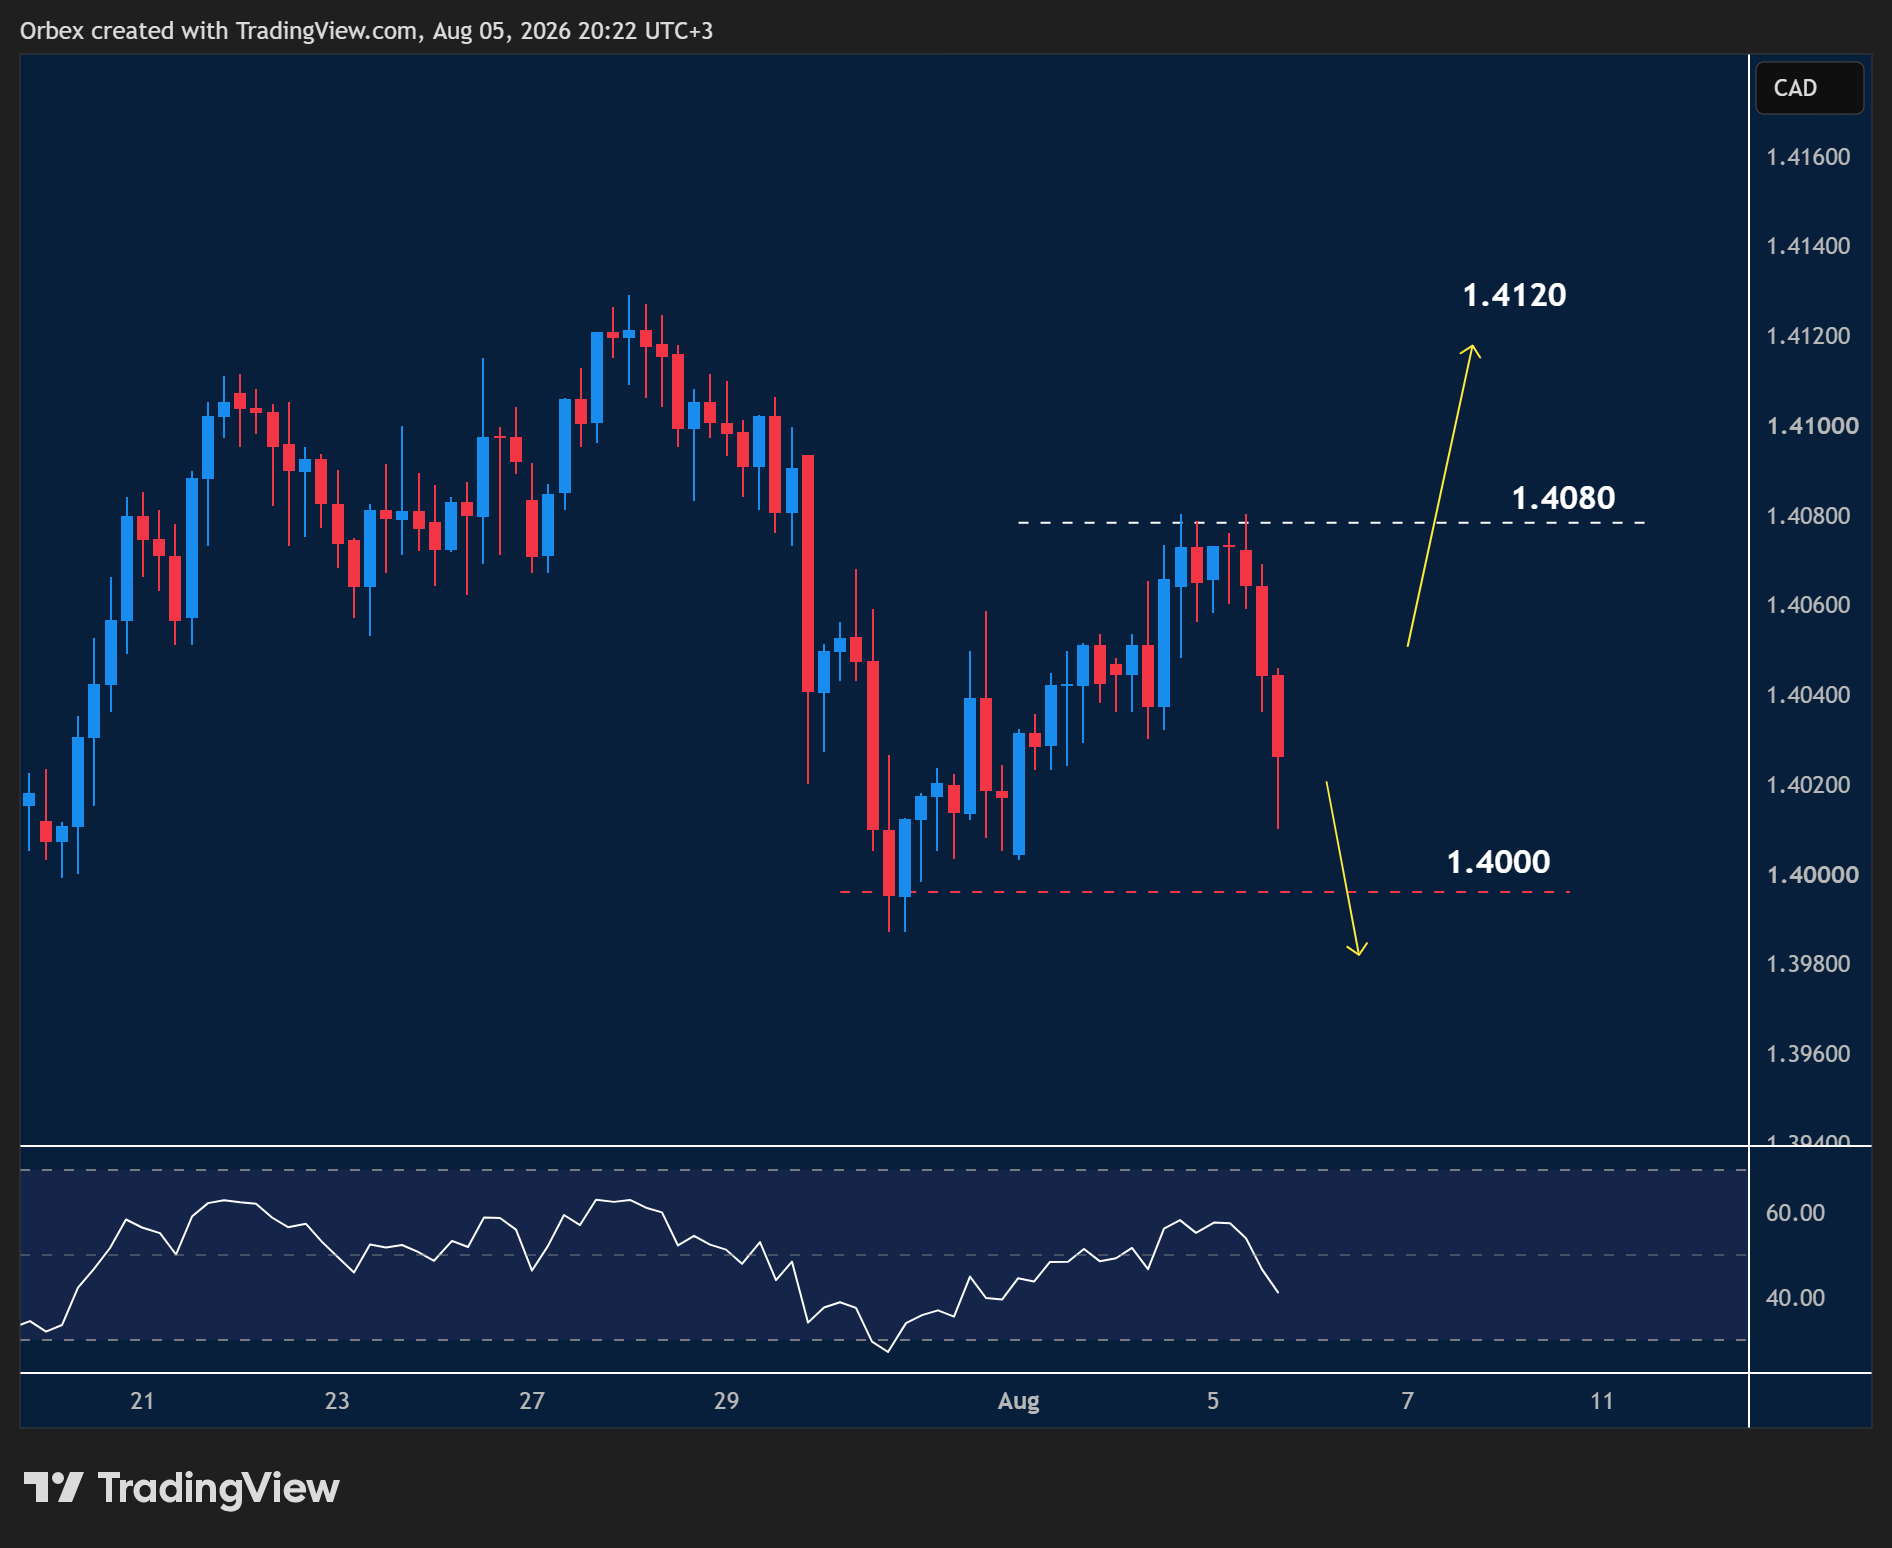
The greenback fell further as traders continue to digest the ongoing peace negotiations in the Middle East.

- The pair progressed lower, breaking through the 1.4050 level, ensuring that the bear run remained intact.
- A slide below the immediate support at 1.4000 could indicate more sellers trading the pair.
- 1.4080 is a critical top to break to develop a sharp turnaround, and move towards the recent top at 1.4120.
NZDUSD looks for reprieve
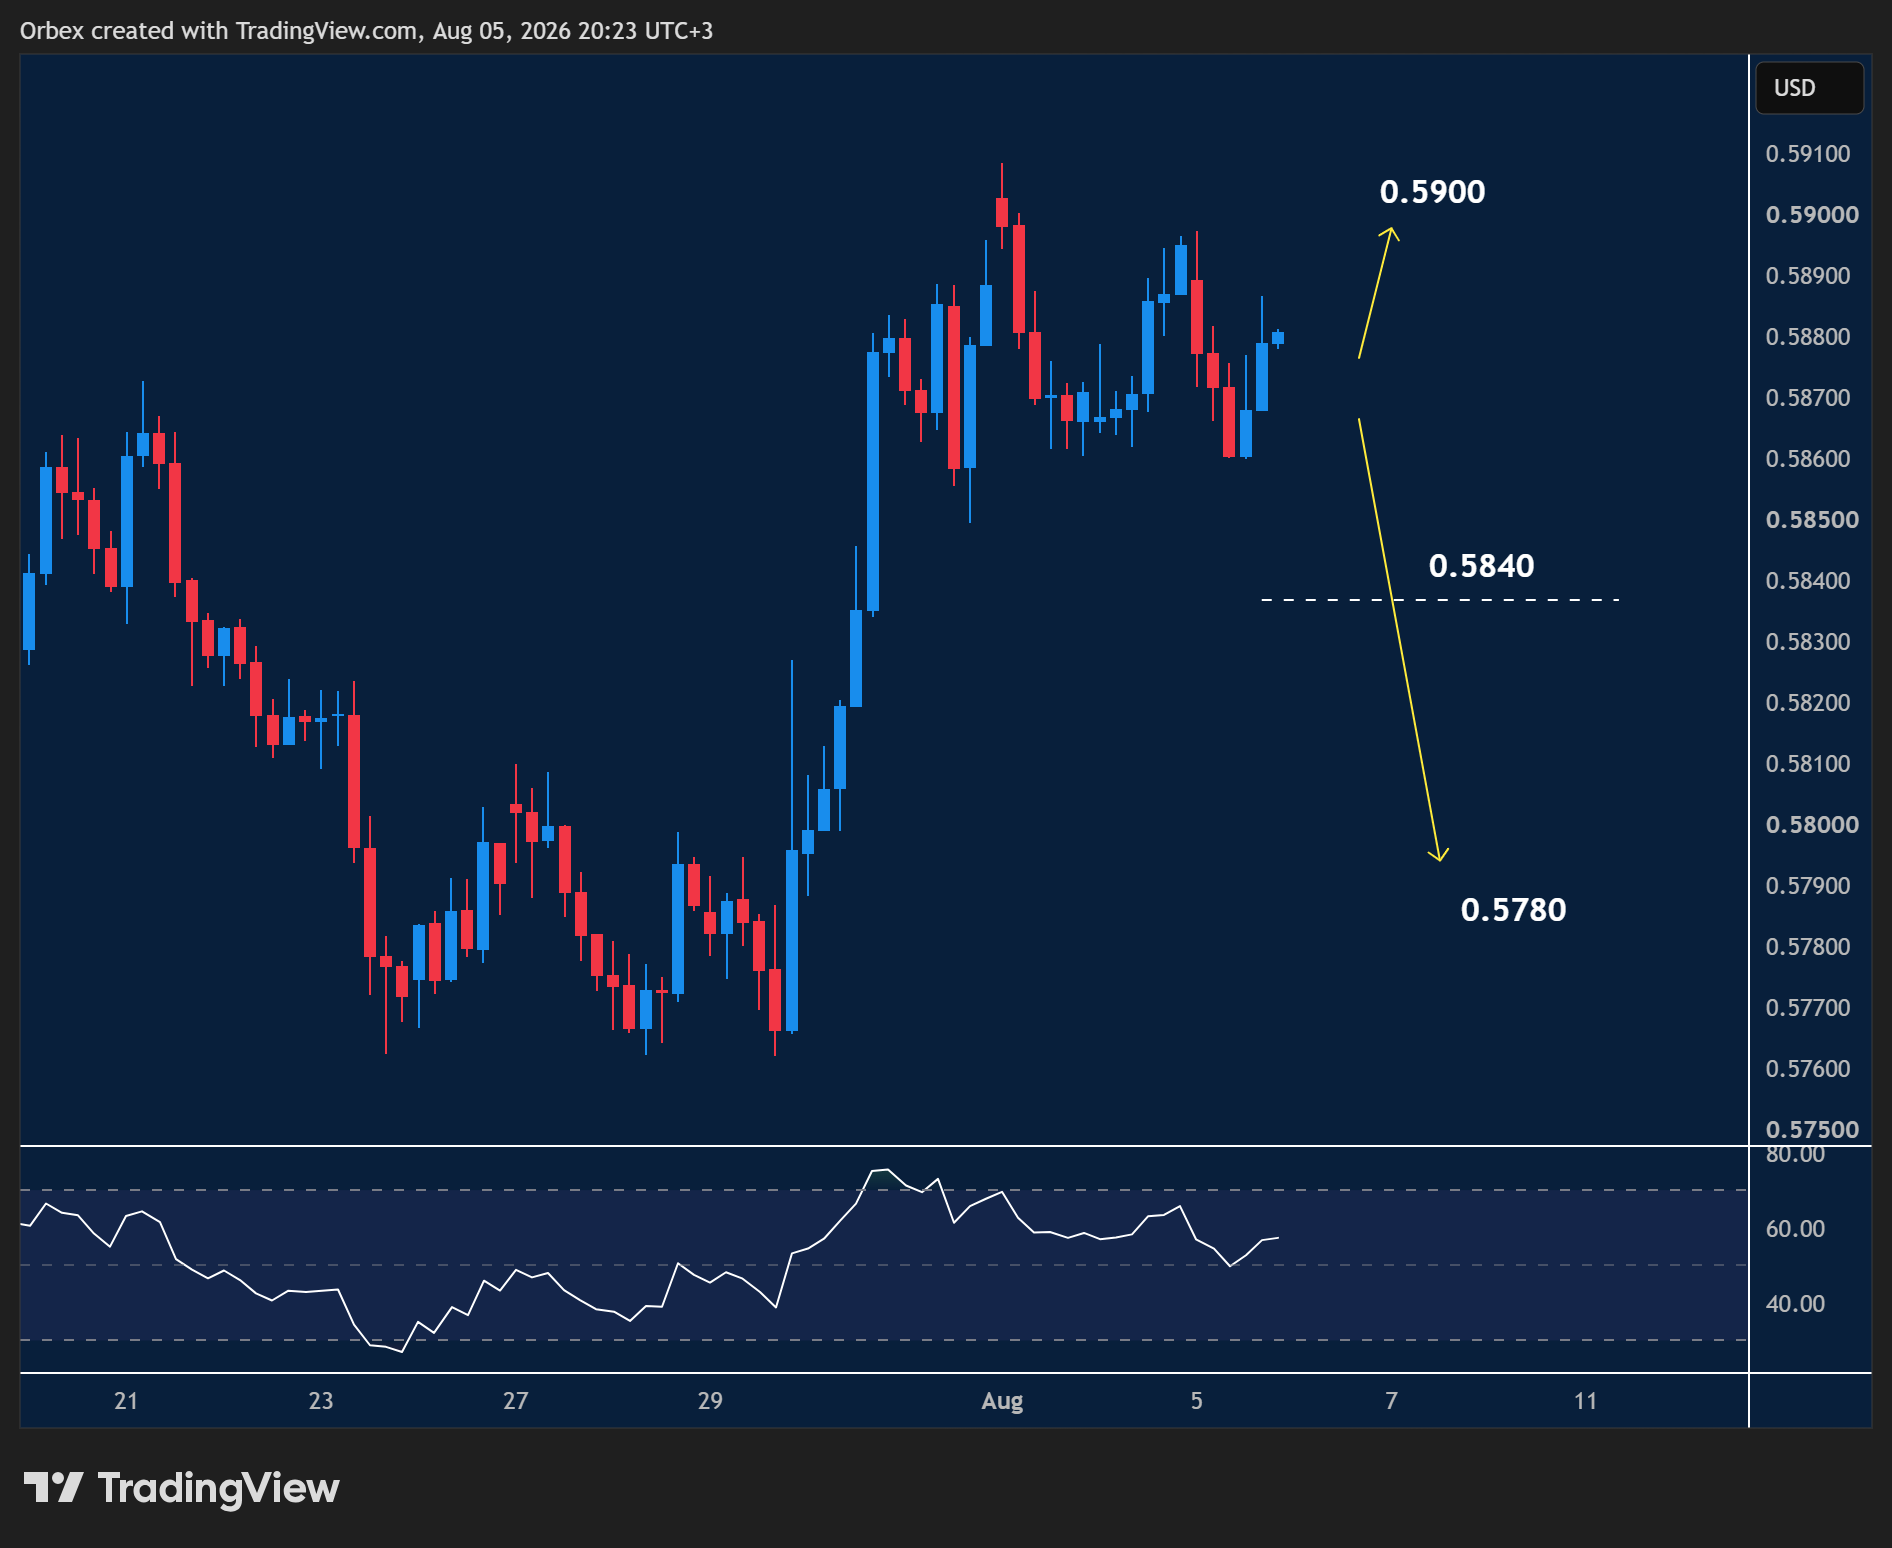
The US dollar is attempting to gain some traction against the Kiwi as a choppy consolidation continues.
- The pair previously met stiff selling pressure at the psychological level of 0.5900 as bulls closed some profits.
- However, more buyers could join the game as the RSI’s pressured condition could lead to a brief pullback.
- 0.5840 is an important support, and its breach could begin a decline in the medium-term to test 0.5780.
UK 100(FTSE) continues chopping grind
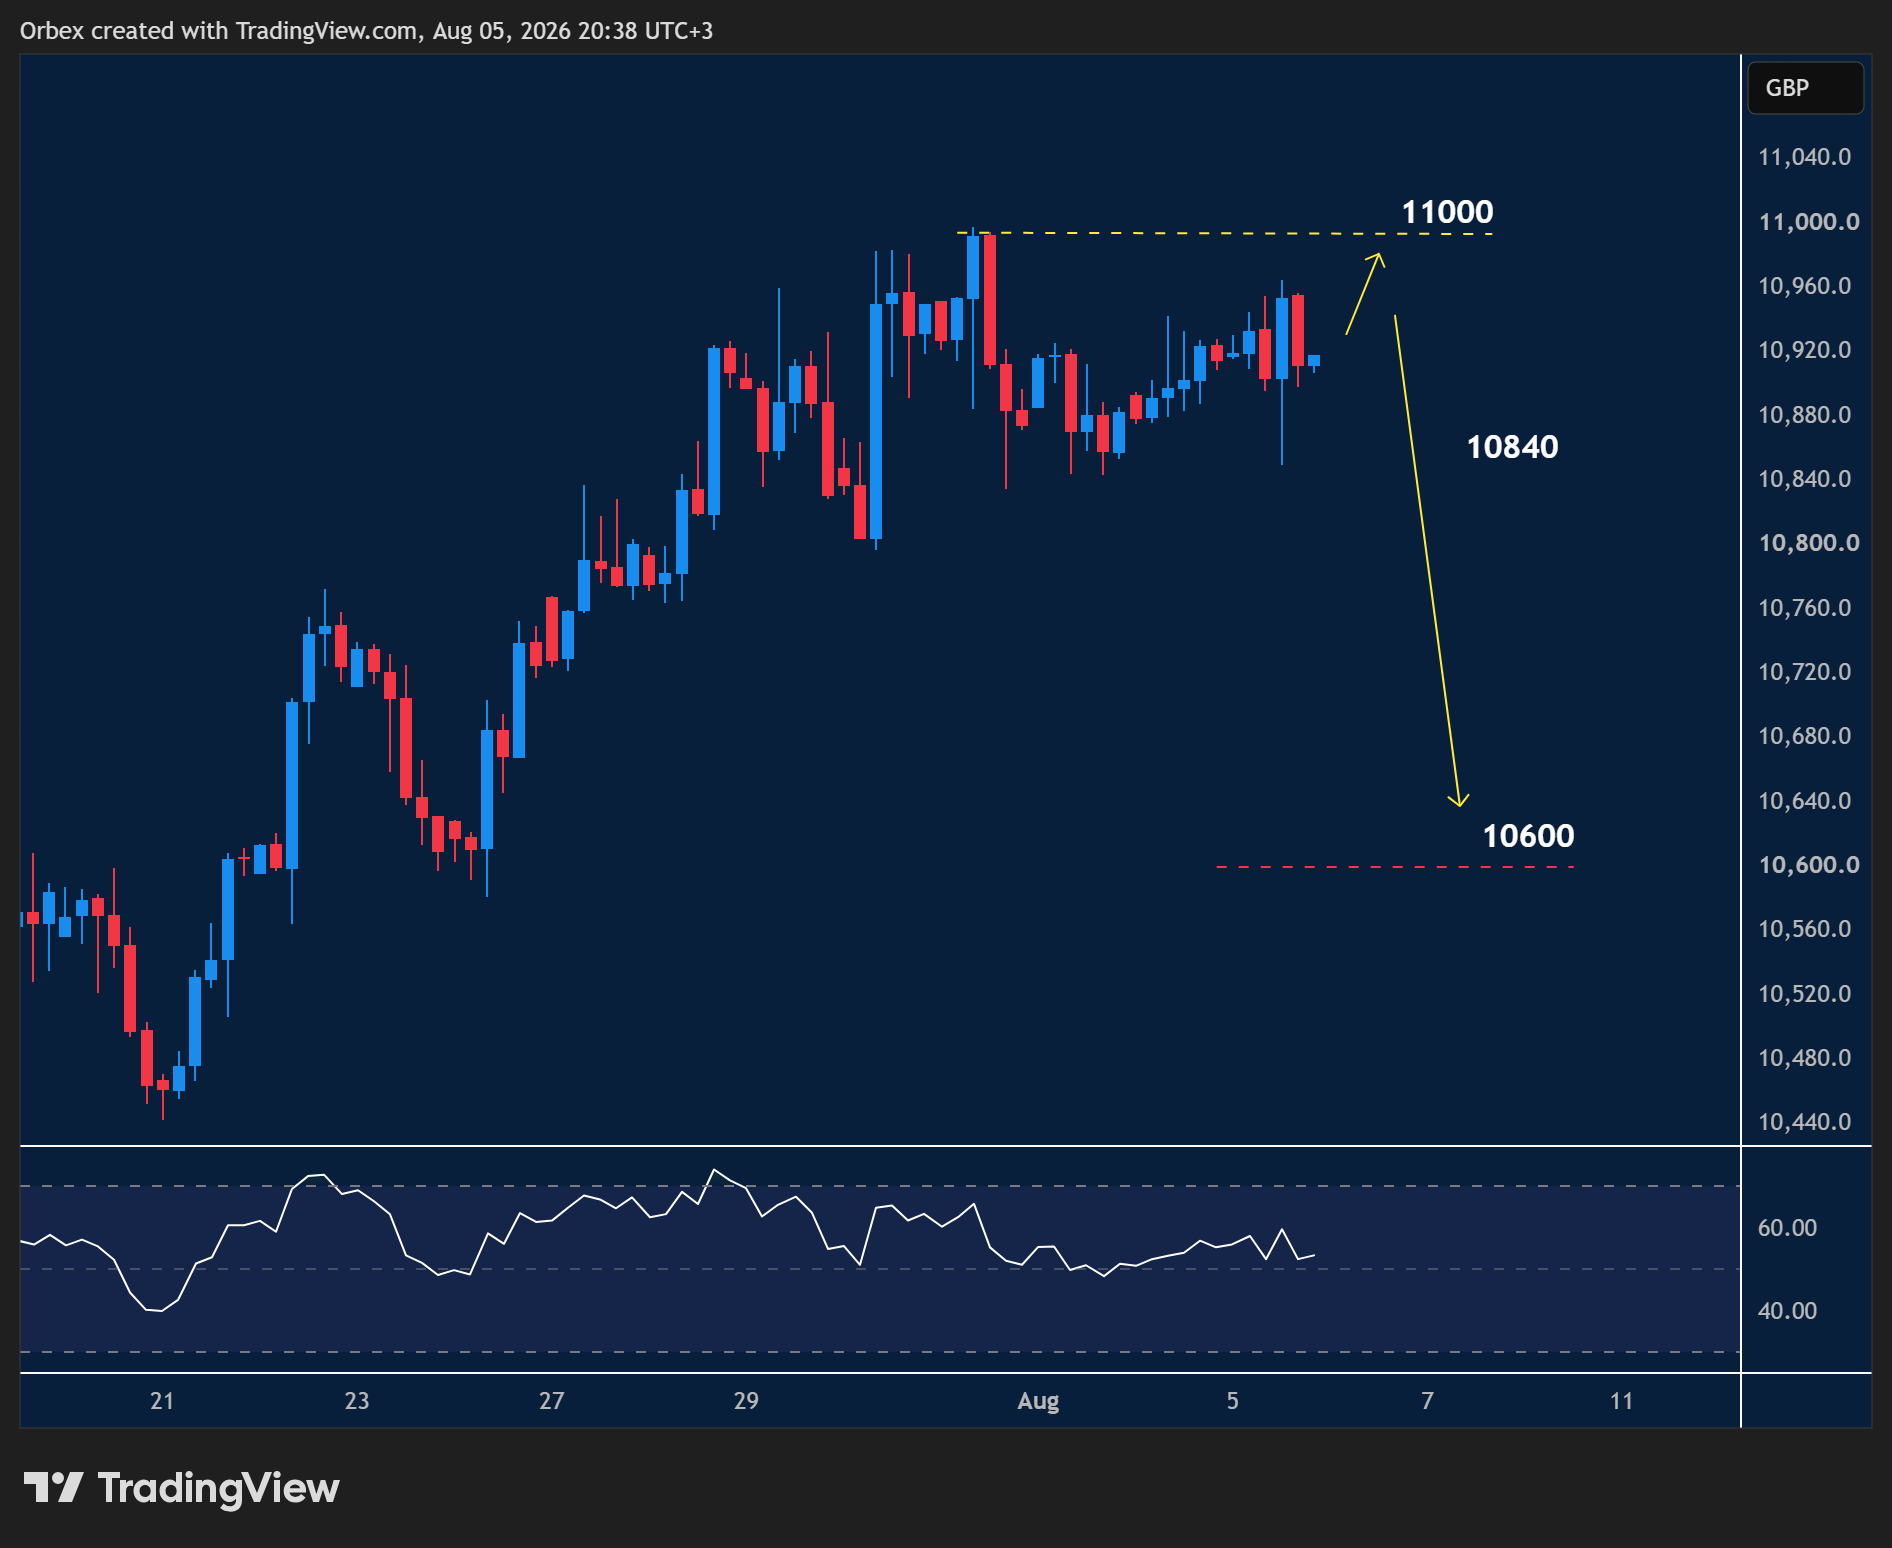
The UK 100(FTSE), along with most global equities, found relief in sustained signs of peace deals.
- The index remains heightened as energy prices are expected to fall further.
- A combination of short-covering and buying-the-dips has helped the price recover some lost ground.
- The first real test comes at the recent false spike towards 11000, and a bullish breakout would attract those who are still indecisive.
- Otherwise, the index could fall back towards 10840 and lower.
Trading the forex market requires extensive research, and that’s what we do best



![Credit Card 160×600 [EN]](https://assets.iorbex.com/blog/wp-content/uploads/2023/06/13144507/Blog-Banner_EN-Banner_160X600X2.webp)


