
NZDUSD cracks critical resistance
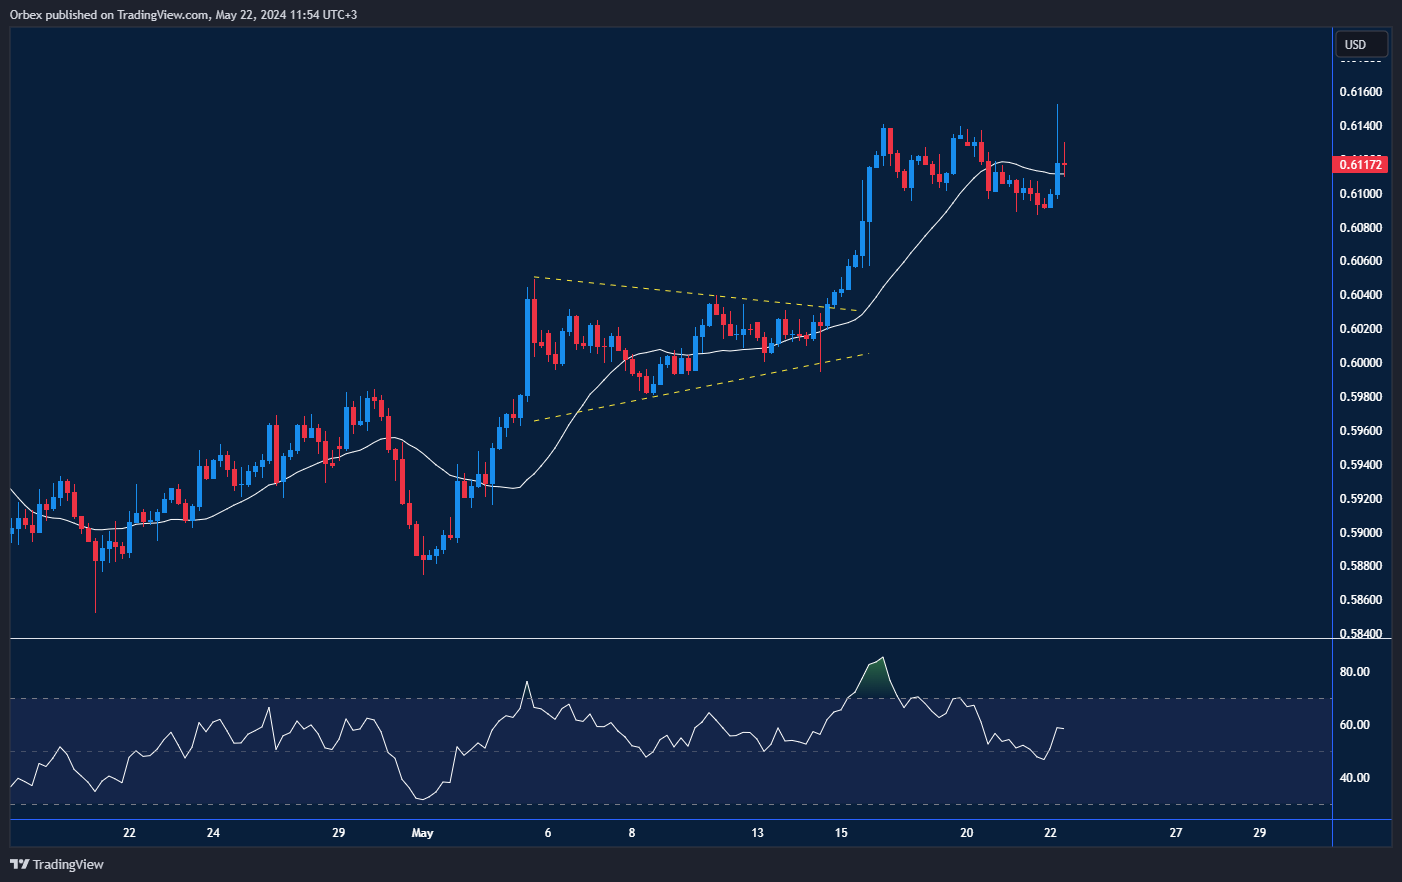
The NZD (New Zealand dollar) continued the bull trend after breaking higher through the recent symmetrical triangle. A push above the demand zone around 0.6050 was a sign of strength, and a close above 0.6100 on the daily chart confirms that bulls have taken over. The psychological level of 0.6200 is the next stop. The RSI’s overbought situation could trigger a limited rebound, and stiff selling pressure can be expected if the recent false spike above 0.6150 loses some traction.
GBPUSD maintains bull rally
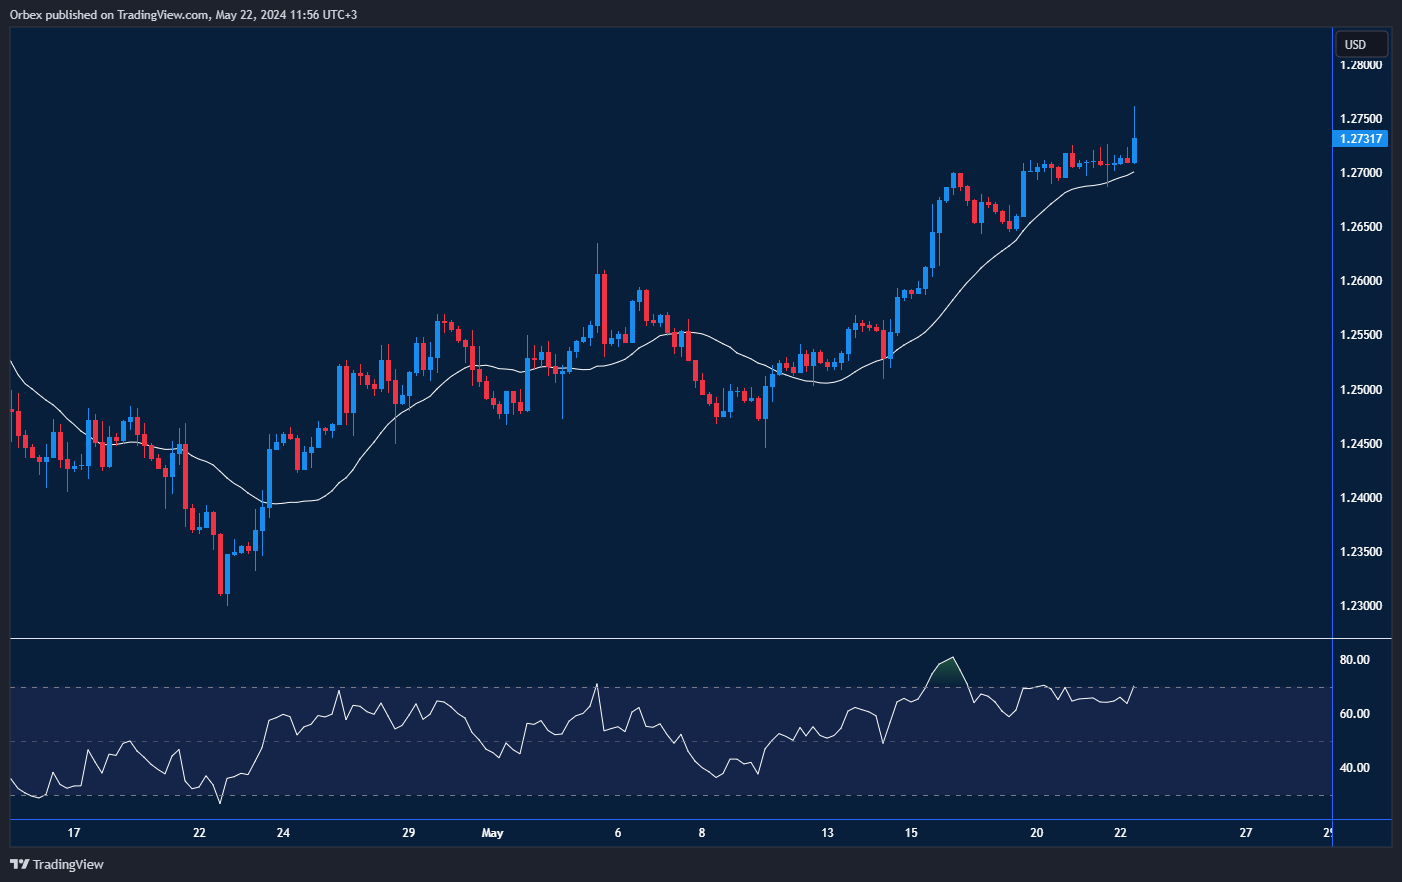
The pound was boosted after progressive inflation data saw a yearly drop of almost 1%. A move above the first daily resistance of 1.2700 has increasingly put the sell side on the defensive. After moving over 200 pips this month, bulls are increasingly optimistic that this year’s high towards 1.2900 is in sight. On the downside, 1.2650 is the first obstacle for bears to bypass to stabilise prices before a sell-off.

UKOIL remains pressured
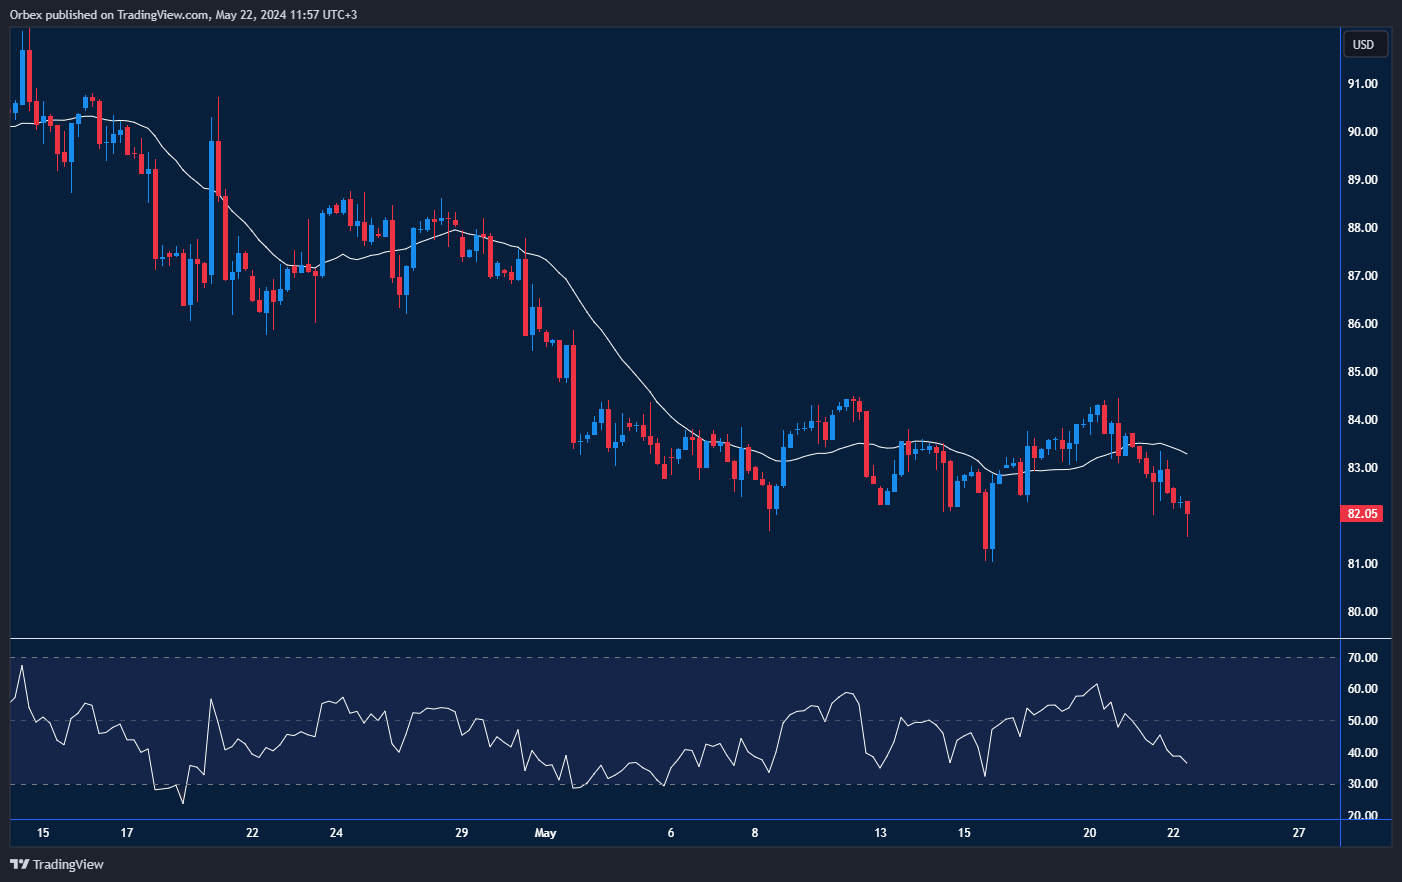
Since February, Brent has fallen to its lowest as rumours swirl about soft consumer and industrial demand. Bulls are striving to keep the latest bounce valid at 81.00 after the price seems to have secured a foothold. A close below 82.00 suggests that the bear rally will continue with 81.40 and 80.55 in sight. Further fresh selling could be expected as the market mood remains cautious, and any chance of a reversal first needs to break 82.50, followed by the previous swing high at 84.00.

