
UK 100 drifts lower
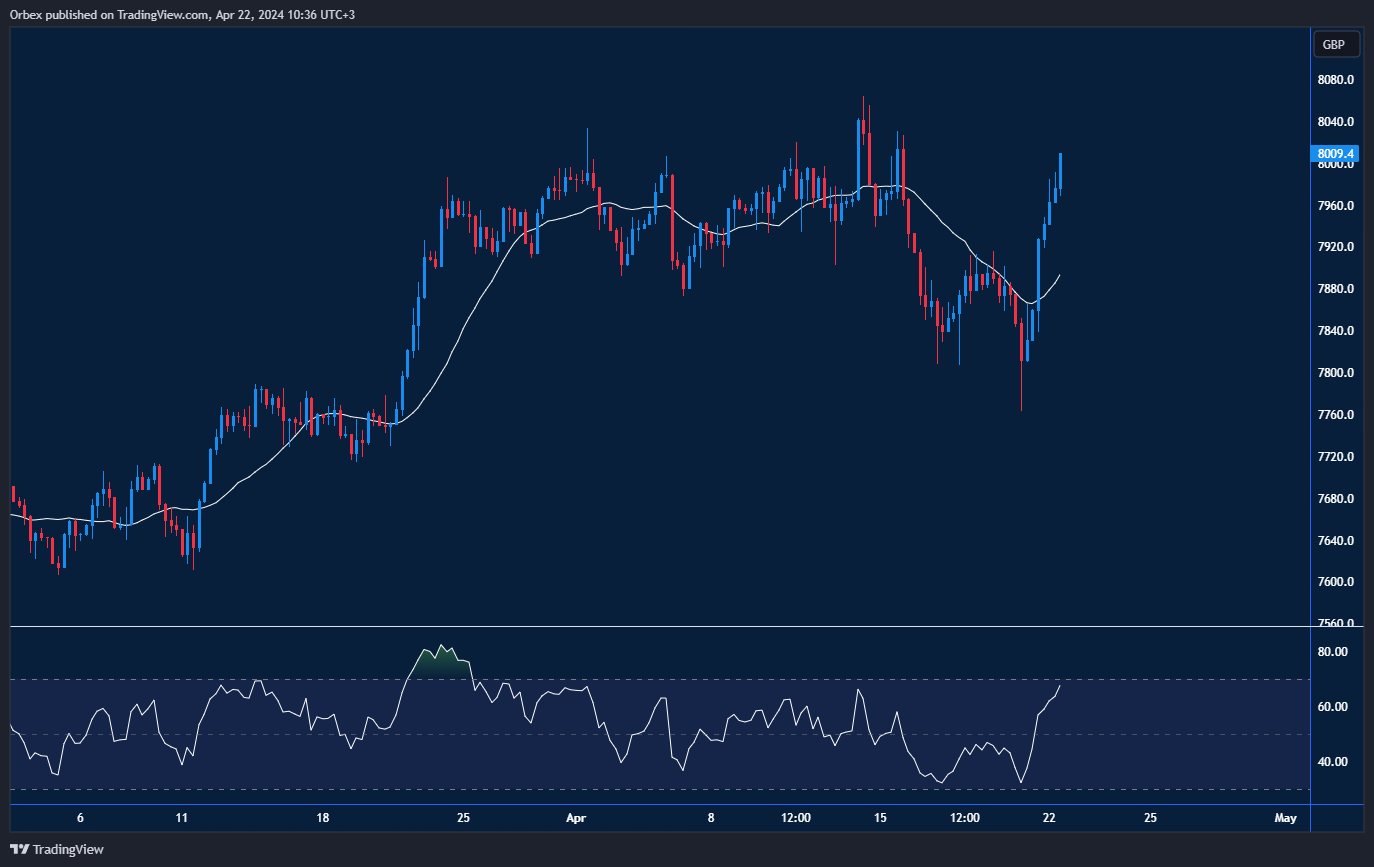
The UK 100 (FTSE 100) maintained its four-day winning streak as it broke the 8000 level again. The V-shaped rally has put the index back right under this year’s high after bouncing at the 7800 area. A continuation could signal a move to a new all-time high above 8060. However, bulls would need to catch their breath and consolidate their gains. 7920 first assesses follow-up interest with a more profound correction testing 7760 on the 20-day SMA.
EURUSD hits support
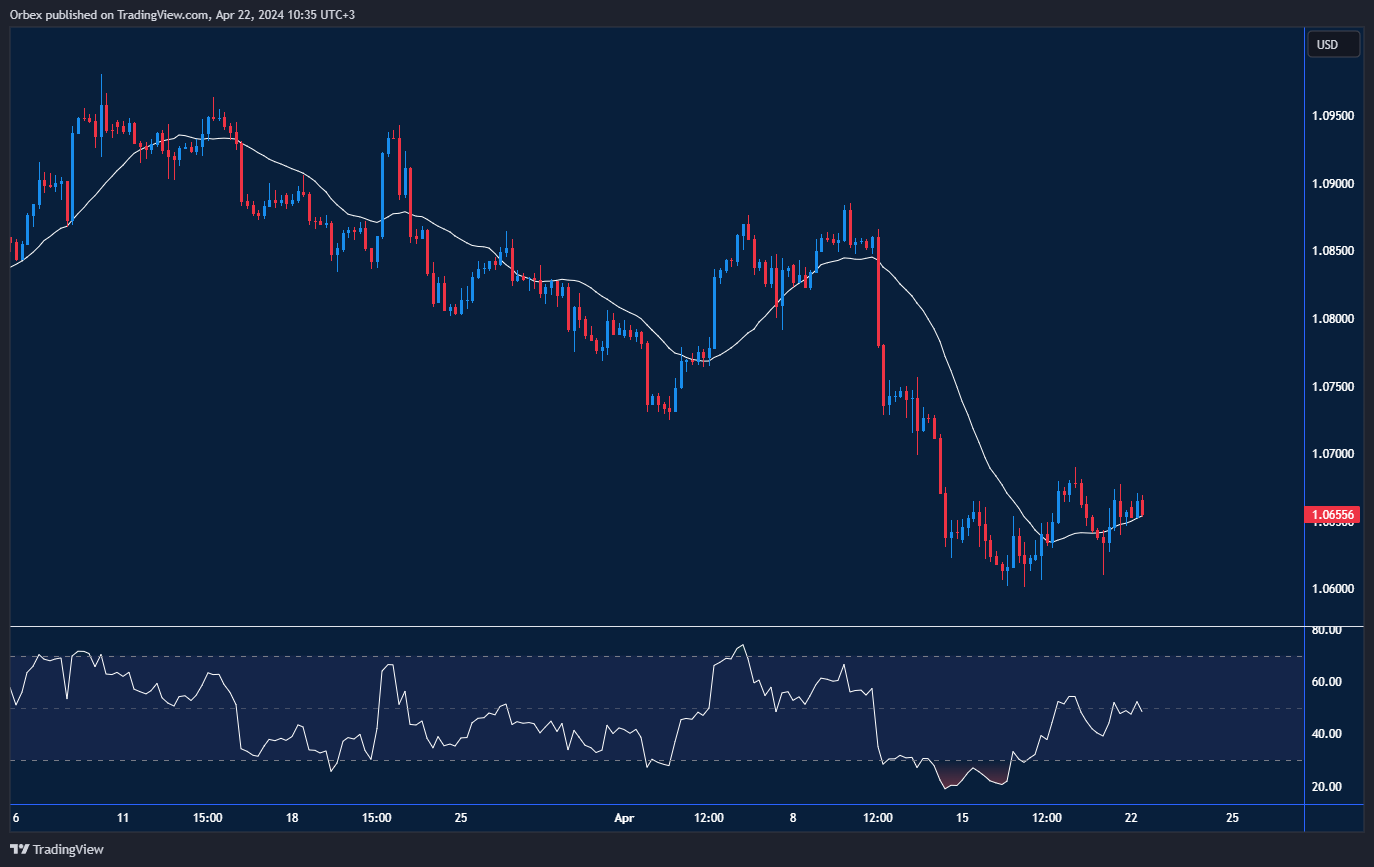
The Euro clawed back losses after sentiment shifted against the dollar. Prices remain resilient after a bounce at the 1.0600 area. A drop below this level would open the door to November’s lows at 1.0520 and could push short-term buyers to the sidelines. With the RSI moving into neutral territory, 1.0860 at the top of the previous bearish downturn will likely be tested. The recent high of 1.1750 is the critical hurdle to break before bulls can regain control.

AUDUSD breaks lower
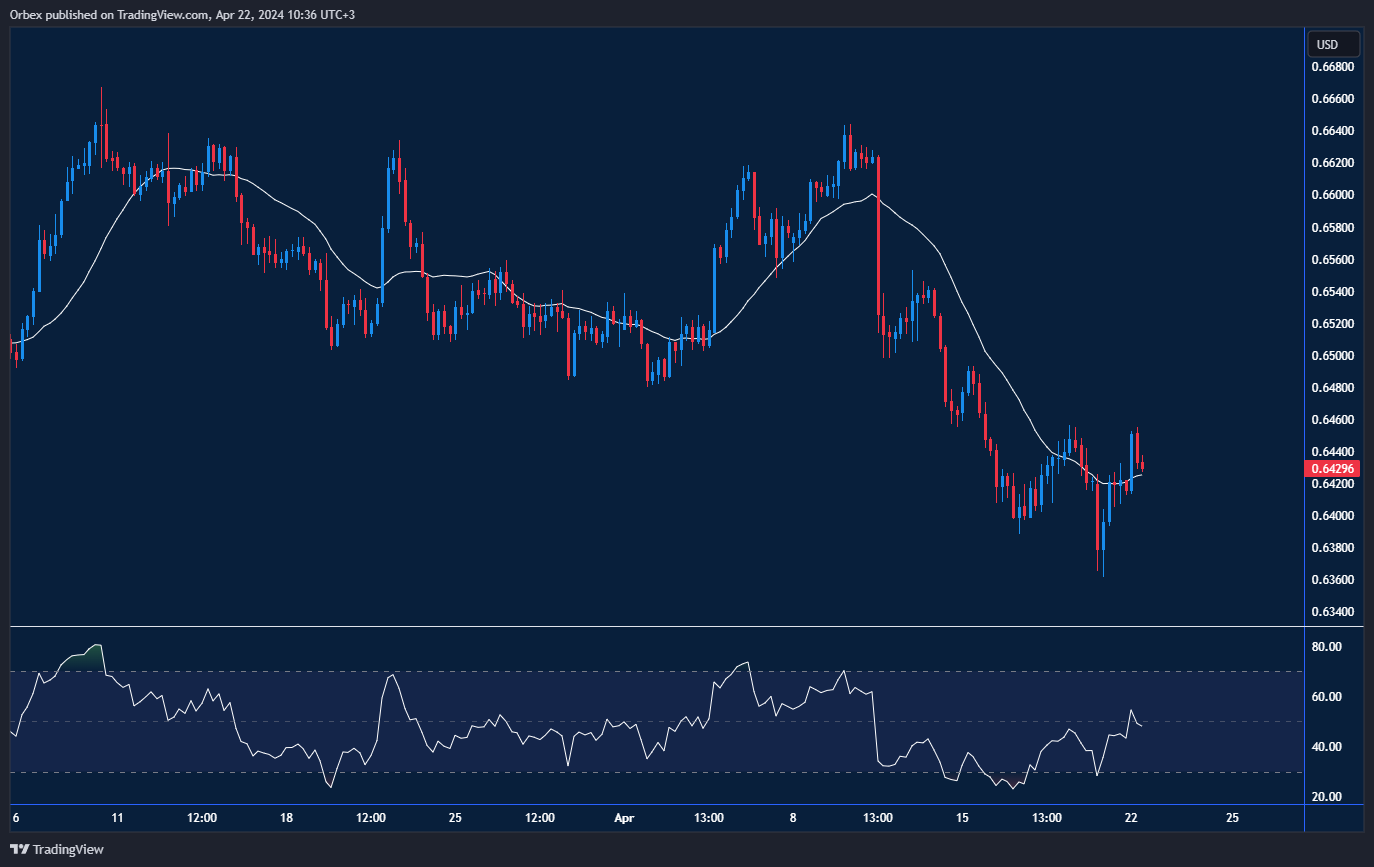
The Australian moved over 100 pips after hitting a double bottom at 0.6360. The pair continued to drive higher despite a downward spiral for most of April. Bulls will need to clear 0.6450 before a meaningful recovery can take shape. Otherwise, a drop below 0.6400 will show little commitment to the buy side, potentially leading to a broader liquidation below the November lows of 0.6330. 0.6500 is a fresh resistance as the RSI attempts to recover into the neutral zone.

![Credit Card 160×600 [EN]](https://assets.iorbex.com/blog/wp-content/uploads/2023/06/13144507/Blog-Banner_EN-Banner_160X600X2.webp)