
NZDUSD tests support
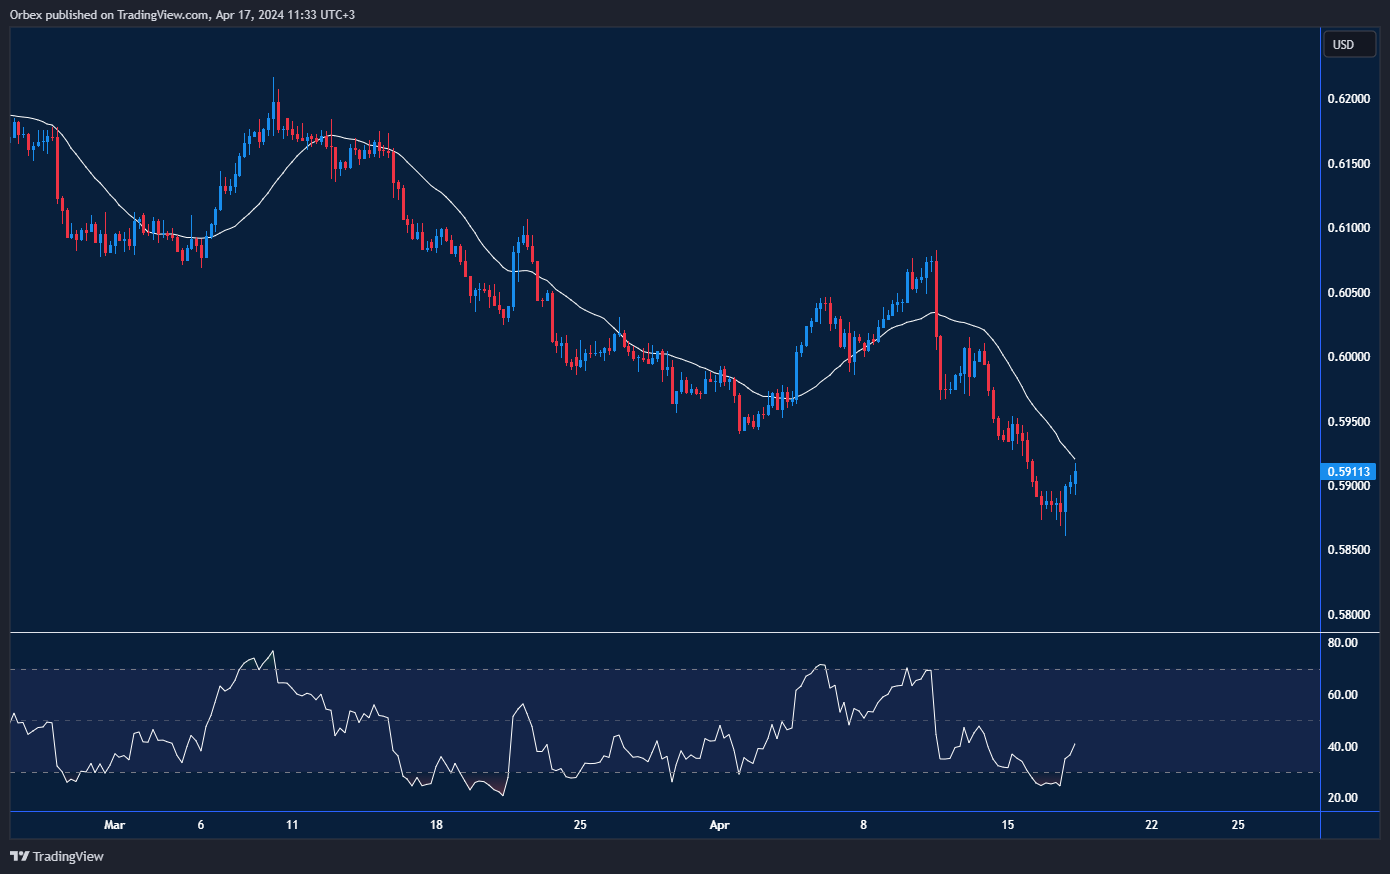
The New Zealand dollar attempted to claw back recent losses after bouncing at the mid-0.5800 area. The pair struggled against the greenback after progressive CPI and NFP data saw over 200 pips wiped off the currency. The rebound could come to a halt at 0.5950 at the 20-day SMA. The bulls’ failure to push back would make the Kiwi vulnerable to a broader sell off. A break below 0.5815 could attract momentum sellers and send the pair past the October low of 0.5770.
USDCHF struggles to hit new high
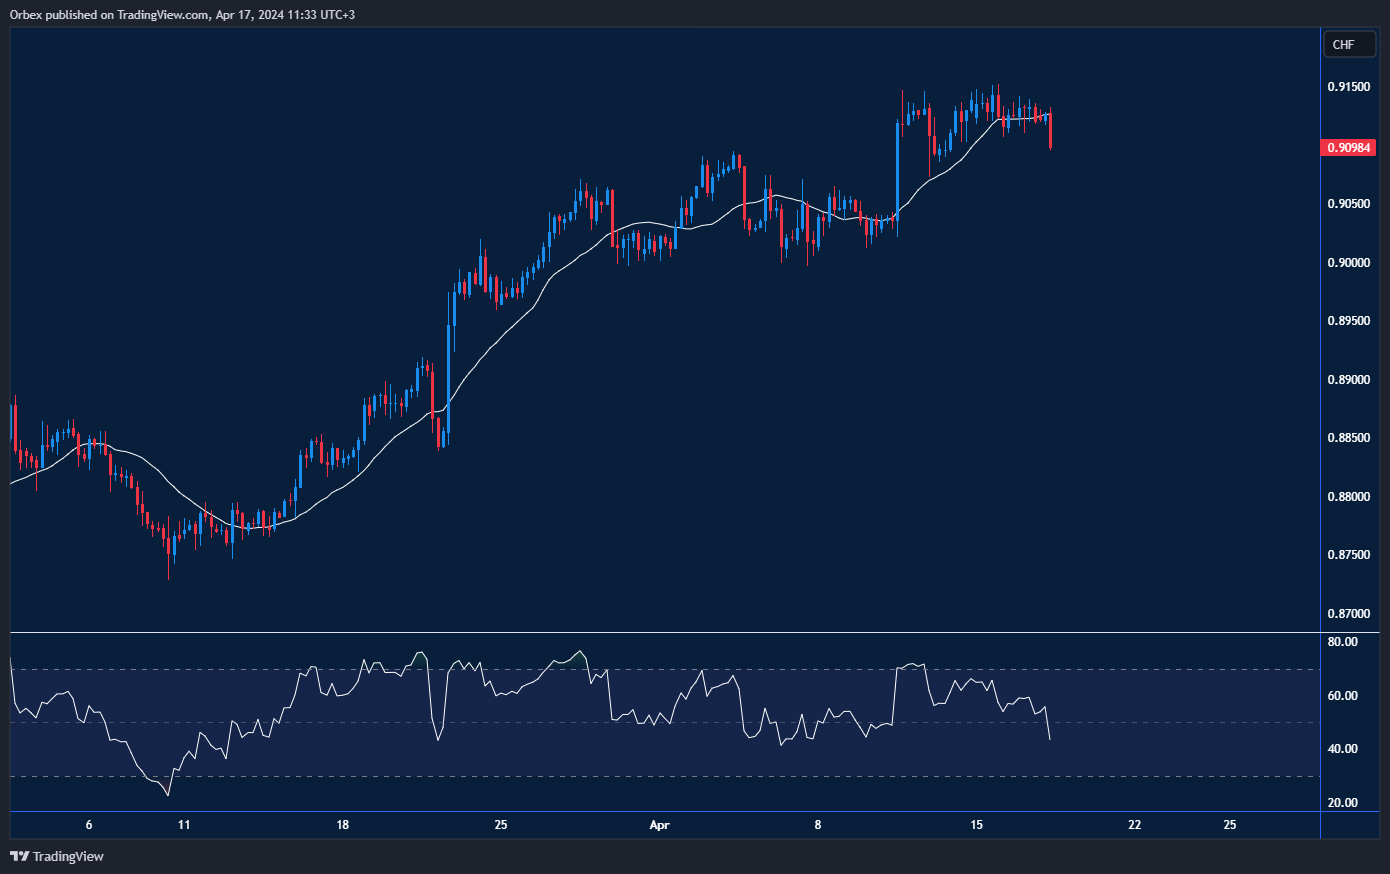
The US dollar broke out of consolidation as it failed to test the 0.9200 level. The recent fall in the pair has struggled to conserve its momentum, with the price turning lower at the psychological level of 0.9100. Near-term sentiment has become downbeat following the breach of the daily support at 0.9080, and bears are likely to sell into strength at rebounds. A fall below 0.8950 would confirm further weakness and expose the greenback to a decline past 0.8840.

S&P500 finally correcting
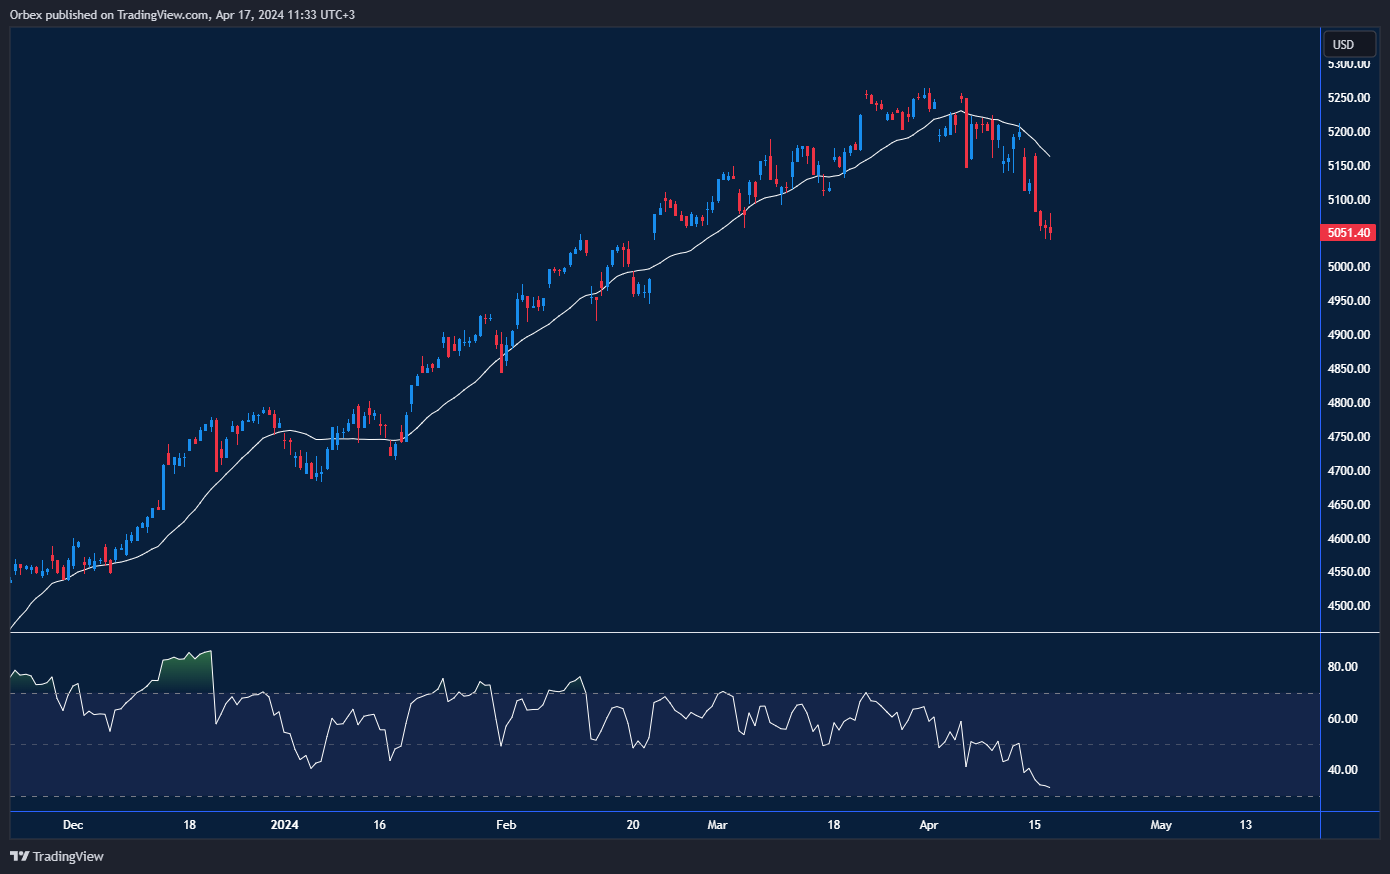
The S&P500 continues to decline as expectations for the Fed to cut interest rates soon lost momentum. The price is now grinding a key supply zone around 5000. The choppy price action shows hesitation as bulls take some chips off the table. On the opposite side, offers could be expected from those who sold high, and an initial break below 4950 could see the downtrend continue. 4890 on the 20-day SMA is a crucial level to keep the rally intact in the short-term, and its breach could trigger a continuation towards 4700.

![Credit Card 160×600 [EN]](https://assets.iorbex.com/blog/wp-content/uploads/2023/06/13144507/Blog-Banner_EN-Banner_160X600X2.webp)