
The UK 100 struggles to bounce
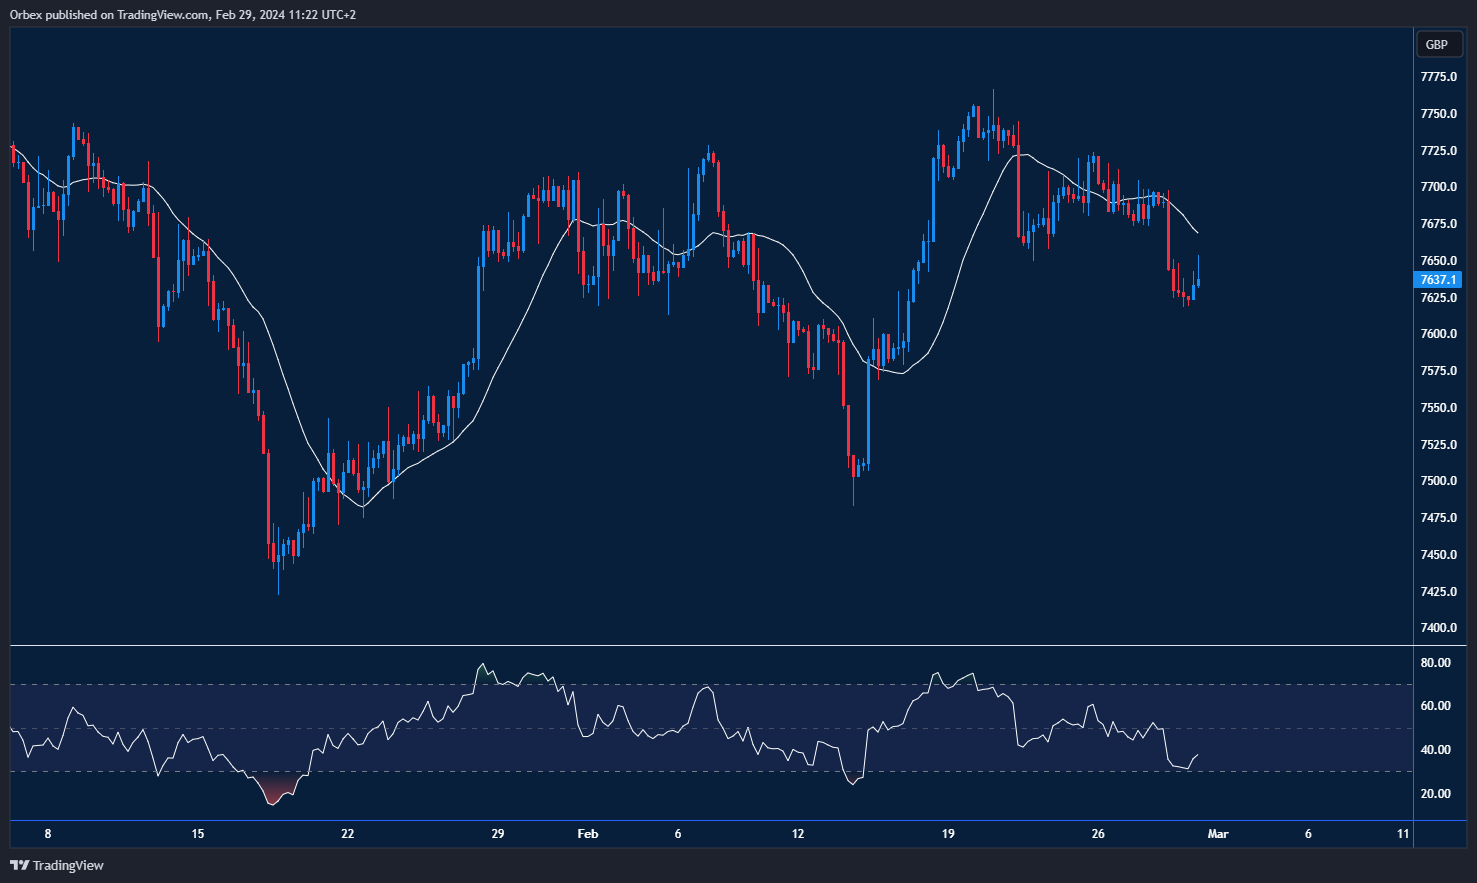
The UK 100 (FTSE) edged higher, halting three straight sessions of losses amid a batch of strong corporate results. The index looks to break out of its descending trend as it pushes for 7650. A correction could be taking shape following a shift in fundamental sentiment. The RSI’s oversold condition has brought in some bids, but that might not be enough to stage a meaningful recovery. Instead, a fall below 7600 could prompt bulls to bail out, triggering a liquidation towards the daily support at 7520.
USDCHF stuck in a triangle
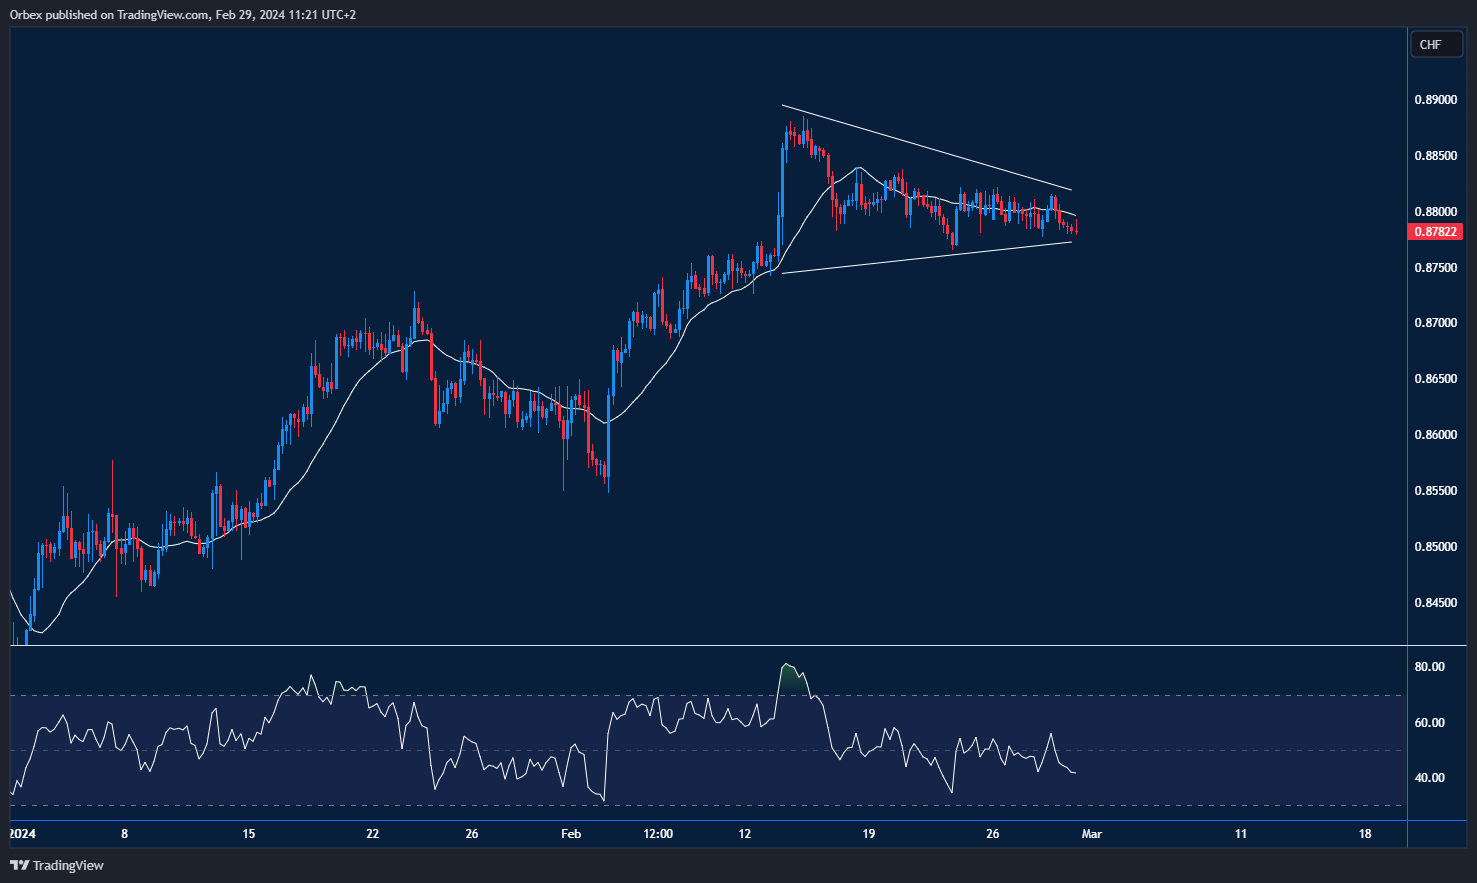
The Swiss franc remains in a symmetrical triangle as GDP data showed signs of progress. On the chart, a close above 0.8800 and a bullish MA cross show that sentiment is turning around. Now that the direction is skewed to the downside, traders see pullbacks as opportunities to sell at a discount. The latest retracement came to a halt at 0.8775 over the 20-day SMA. A close back above 0.8865 would pave the way for an extended rally towards the supply area around 0.8910.

USDCAD another wave higher
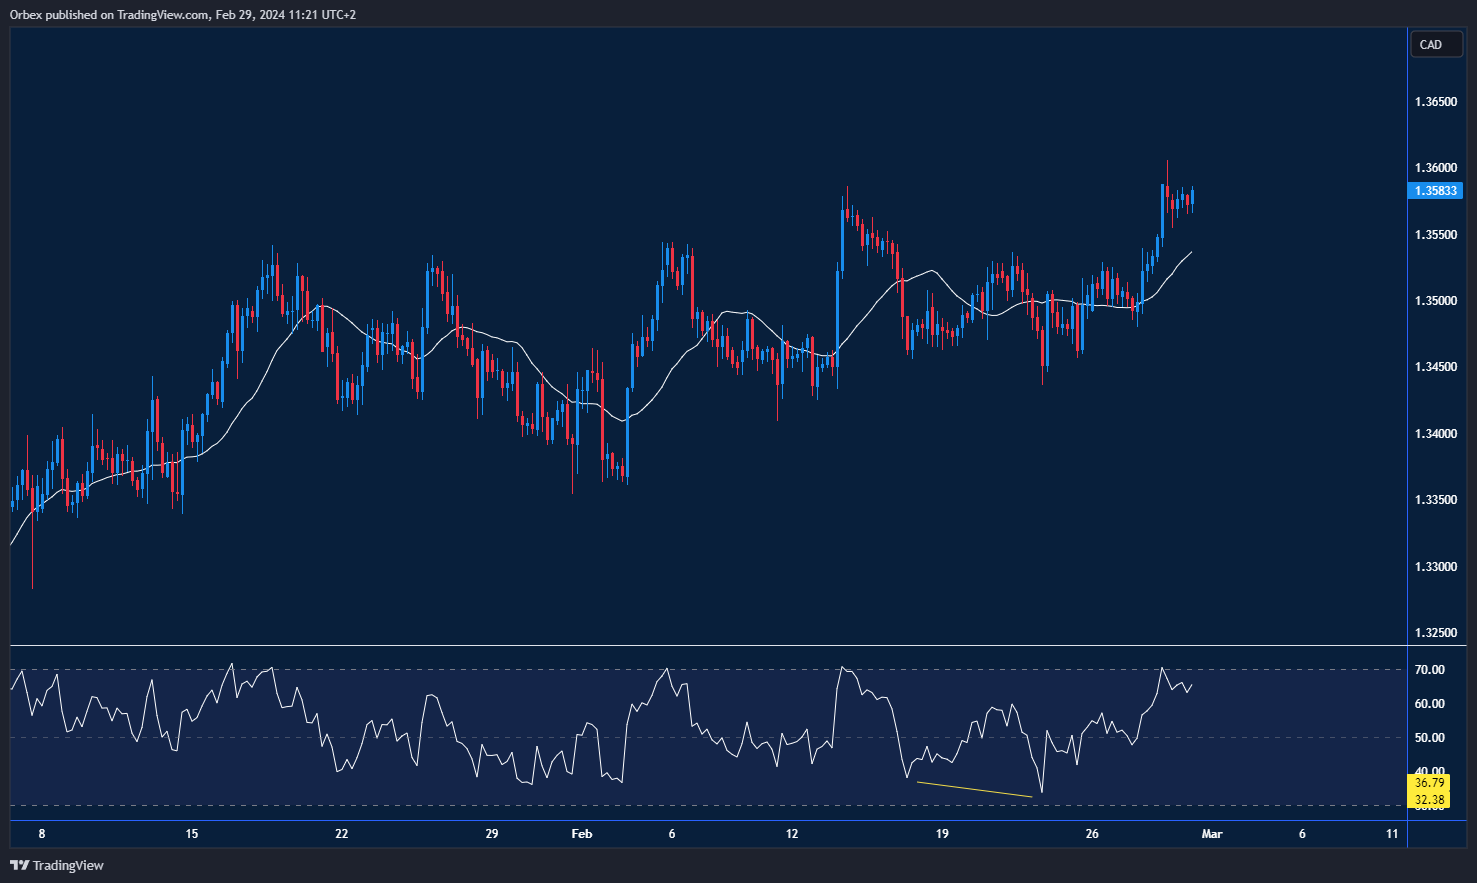
The Canadian dollar softened after mixed manufacturing and wholesale data. The pair is looking for another wave higher, as impulse buying has moved towards 1.3600 for the first time since December. The recent bullish divergence on the RSI has also added to the bullish sentiment. Further down, the confluence of the previous swing low of 1.3480 and the 20-day SMA is a significant support. A decisive break above 1.3640 would trigger a runaway rally and resume the uptrend soon.

![Credit Card 160×600 [EN]](https://assets.iorbex.com/blog/wp-content/uploads/2023/06/13144507/Blog-Banner_EN-Banner_160X600X2.webp)