
USDJPY meets major support
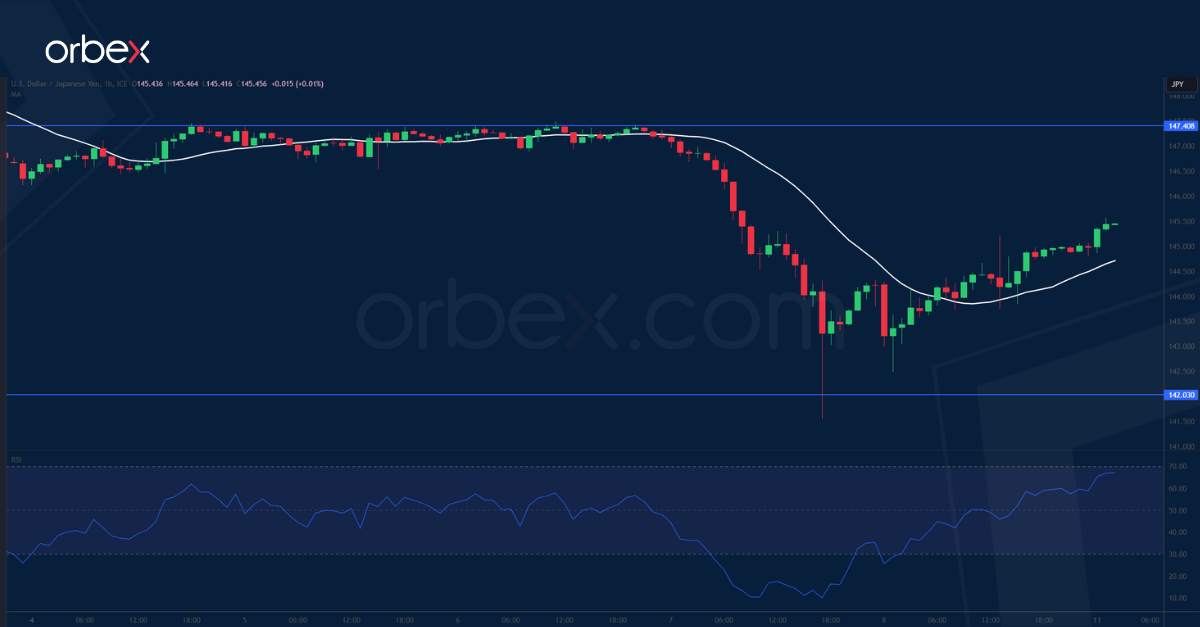
The Japanese yen consolidates its gains after hints of tightening monetary policy from the BOJ. The recent sharp sell-off has come to a halt at the base of a breakout rally back in August. A long lower candle wick around 142.00 indicates a rejection of lower bids, probably thanks to an intervention of bargain hunters. From the medium-term perspective, the trajectory remains upward even though the immediate price action could be choppy. 147.40 then 149.70 are the two levels to clear before the uptrend could resume.
USDCAD tests resistance

The US dollar held strong after new data suggested job growth accelerated in November. The latest rebound has met renewed selling pressure at the previous support-turned-resistance of 1.3620. Its breach might prompt the bears to put their feet off the pedal and trigger a recovery towards 1.3770. Failing that, 1.3530 is the immediate support and its breach would mean that the path of least resistance is down. A drop below the recent bottom of 1.3480 would expose 1.3400 and put the October rally at the risk of a bearish reversal.

US 30 holds onto gains
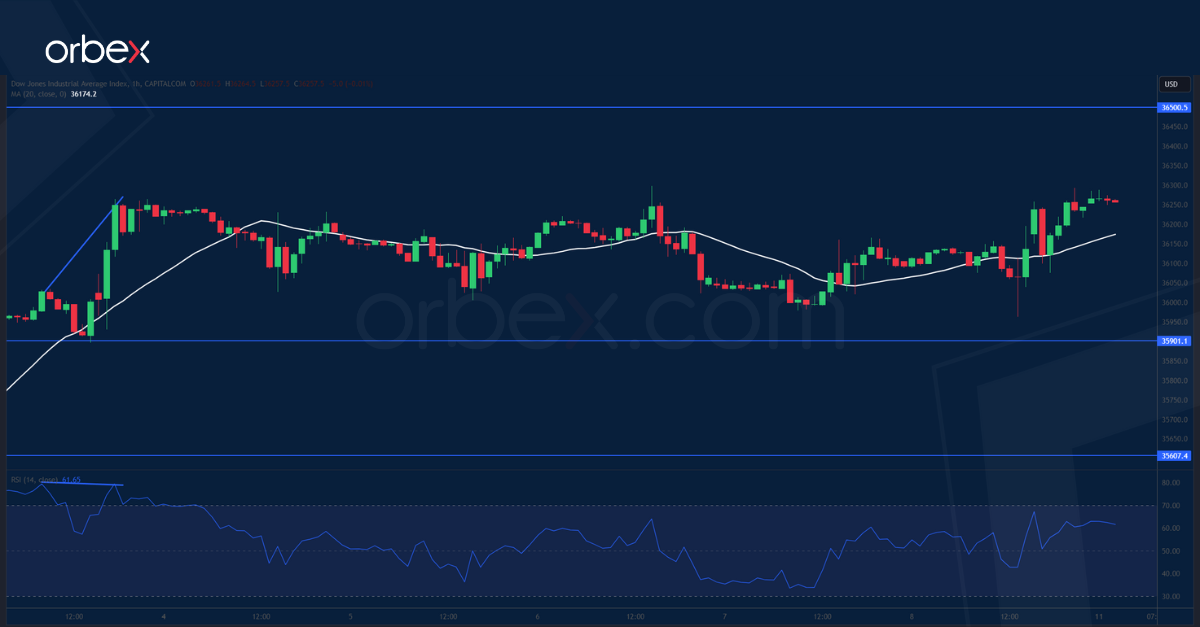
The Dow Jones 30 inches higher after solid nonfarm payrolls data cemented the hope of a ‘soft landing’. The index is heading towards 36500 but the steep ascent since the end of October could be looking for some breathing room as the daily RSI indicates an increasingly overbought condition. Zooming into the hourly chart, a bearish RSI divergence suggests a deceleration in the momentum but only a fall below 35900 would confirm weakness. The former resistance of 35600 on the 20-day SMA would be a second line of defence.

![Credit Card 160×600 [EN]](https://assets.iorbex.com/blog/wp-content/uploads/2023/06/13144507/Blog-Banner_EN-Banner_160X600X2.webp)