
USDCHF grinds lower
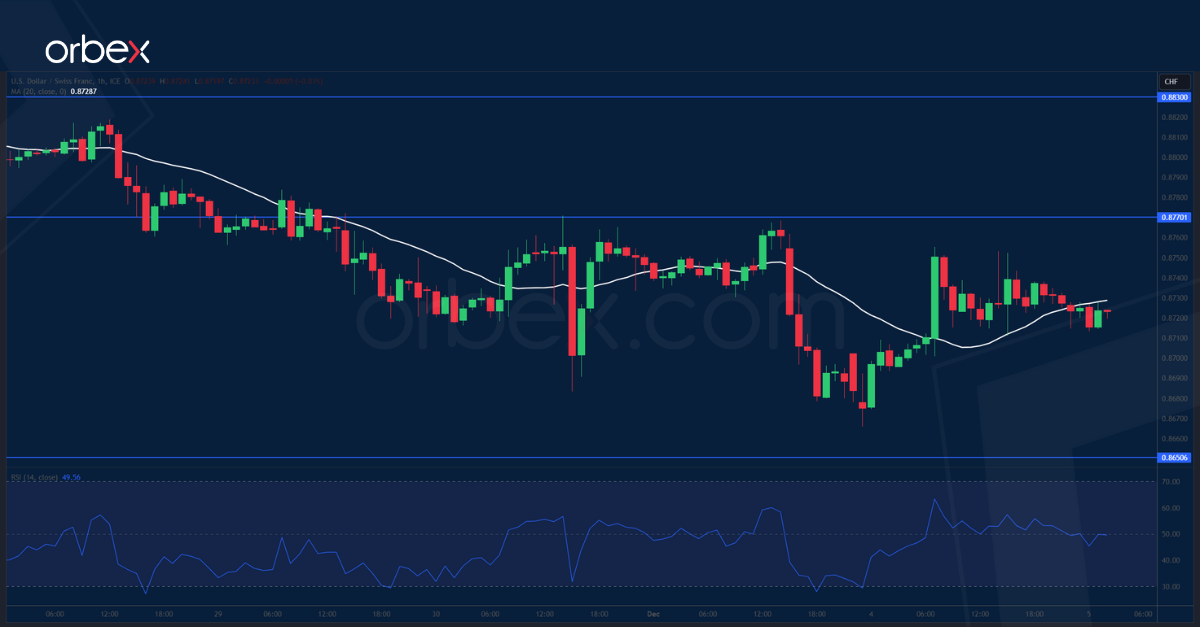
The Swiss franc stalled after November’s CPI showed a large slowdown. The pair has given up most of the gains from the July rally and the lack of swing highs suggests a constant selling pressure. 0.8650 is the current level to see whether the buy side would start to make a comeback. 0.8770 is the first resistance and 0.8830 next to the 20-day SMA would act as a bearish magnet. A failure to bounce in a meaningful way would send the greenback to the critical floor at 0.8560, at the risk of a prolonged bearish thrust.
USDJPY seeks support
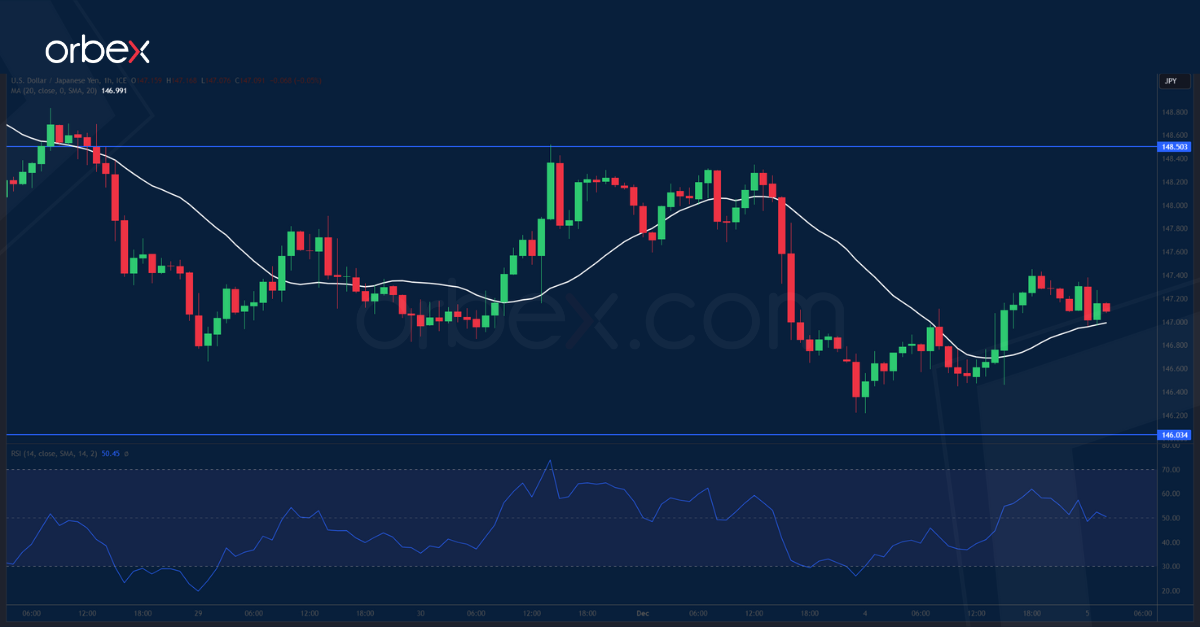

The Japanese yen weakened after a lower-than-expected CPI in the Tokyo area in November. A snapback at the support-turned-resistance of 148.50 indicates that the path of least resistance is still down. The round number of 146.00 saw some buying interests after the RSI sank into the oversold area. However, the bulls will have the challenging task of lifting 148.50 then 149.70 before they could hope for a robust rebound. On the downside, the demand zone 144.60-145.00 is important in preventing a deep correction.
SPX 500 tests major resistance
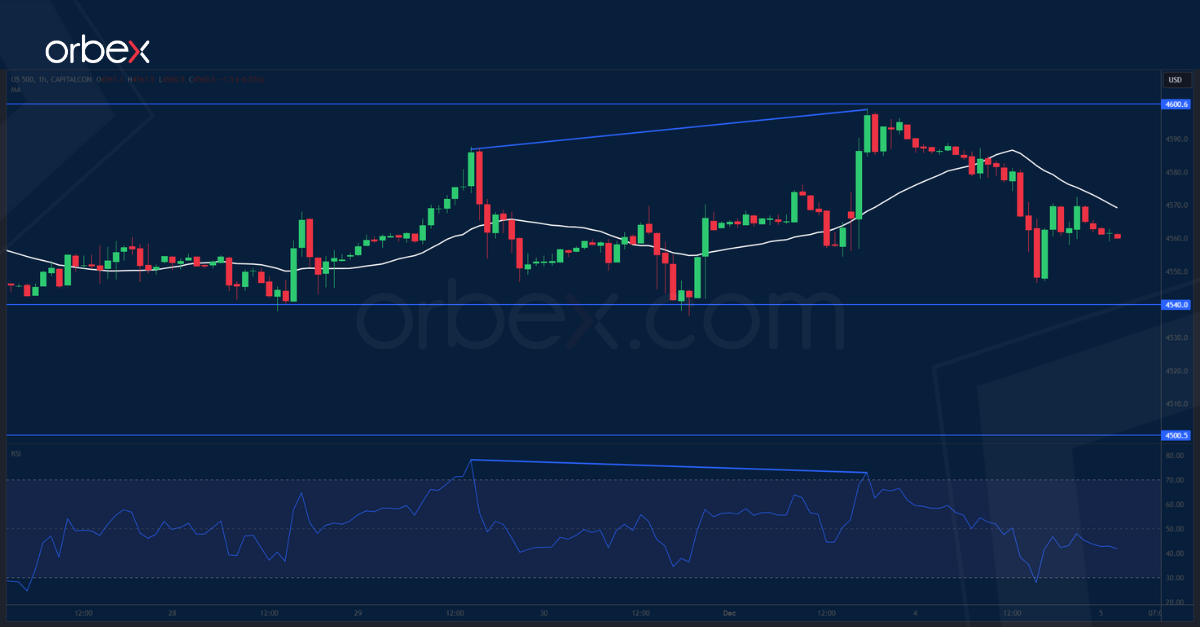
The S&P 500 holds onto gains as investors doubt there will be more rate hikes. As the index reached last summer’s high of 4600, a bearish RSI divergence reveals a drop in the momentum. Both profit-taking and fresh selling might put the price action under pressure in this significant area. The bears would look for a break below 4540 to trigger a liquidation of short-term positions, confirming the divergence play. Then 4500 over the 20-day SMA would be a second support. A bullish breakout though, would open the door to 4750.

