
NZDUSD meets support
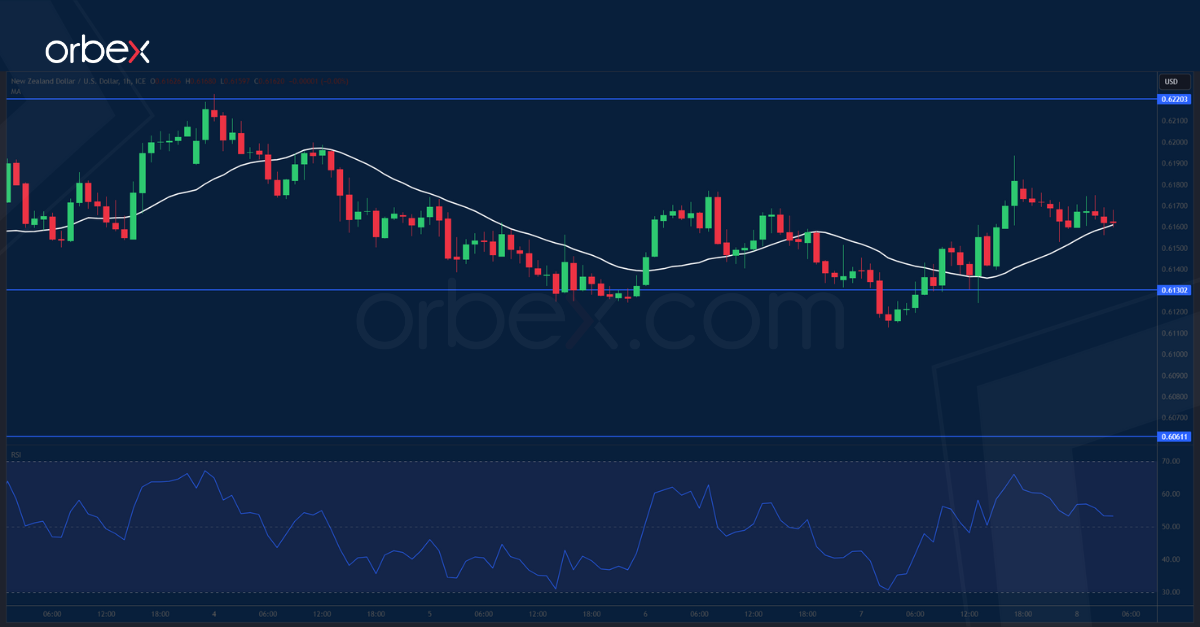
The US dollar dips as traders hope to see signs of a weaker labour market. As the price grinds last August’s high of 0.6220, an oversold RSI on the daily chart certainly puts pressure on the short-term enthusiasm. A fall below 0.6120 has forced some weak hands out, putting the kiwi on a consolidation pattern. 0.6130 saw fresh bids and 0.6060 on the 20-day SMA is an important support as its breach could trigger a broader liquidation towards the psychological tag of 0.6000. On the upside, 0.6220 is the immediate obstacle.
EURGBP struggles for bids
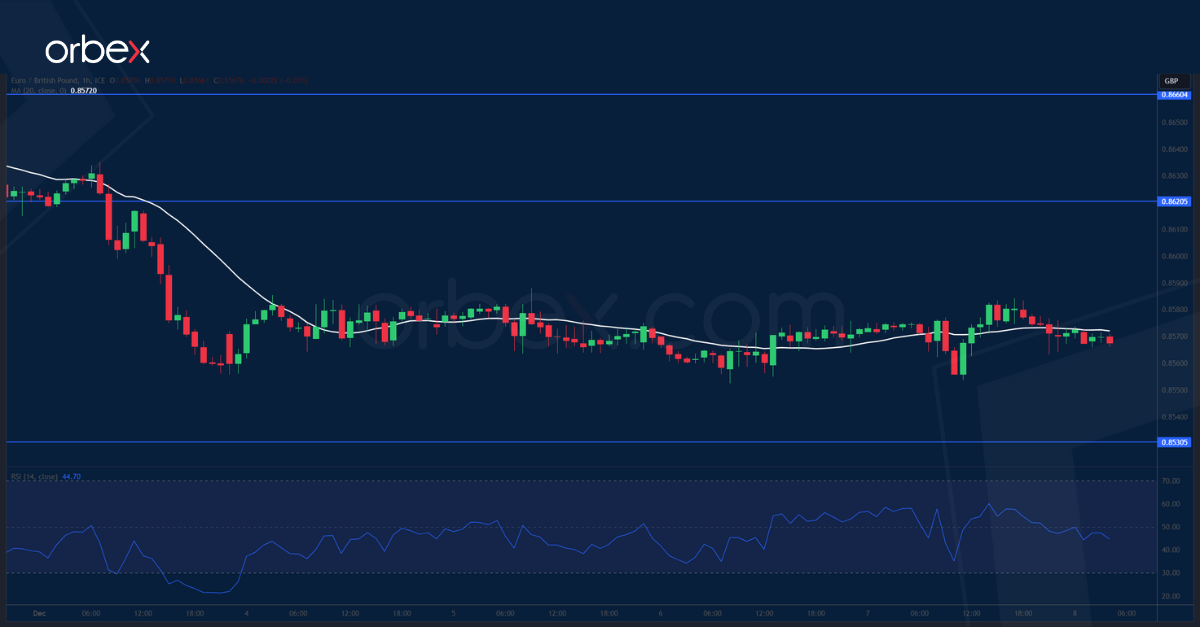
The euro slipped after the GDP across the bloc flatlined in the third quarter. On the daily chart, successive breaks below previous swing lows of 0.8660 and 0.8620 have put buyers of the rebound on the defensive. The demand zone between last summer’s trough at 0.8500 and the base of the September rally at 0.8530 is a major level to see signs of stabilisation. If bargain hunters start to join the auction, the former support levels of 0.8620 and 0.8660 would need to go to pave the way for a sustained bounce.

FTSE 100 holds onto gains
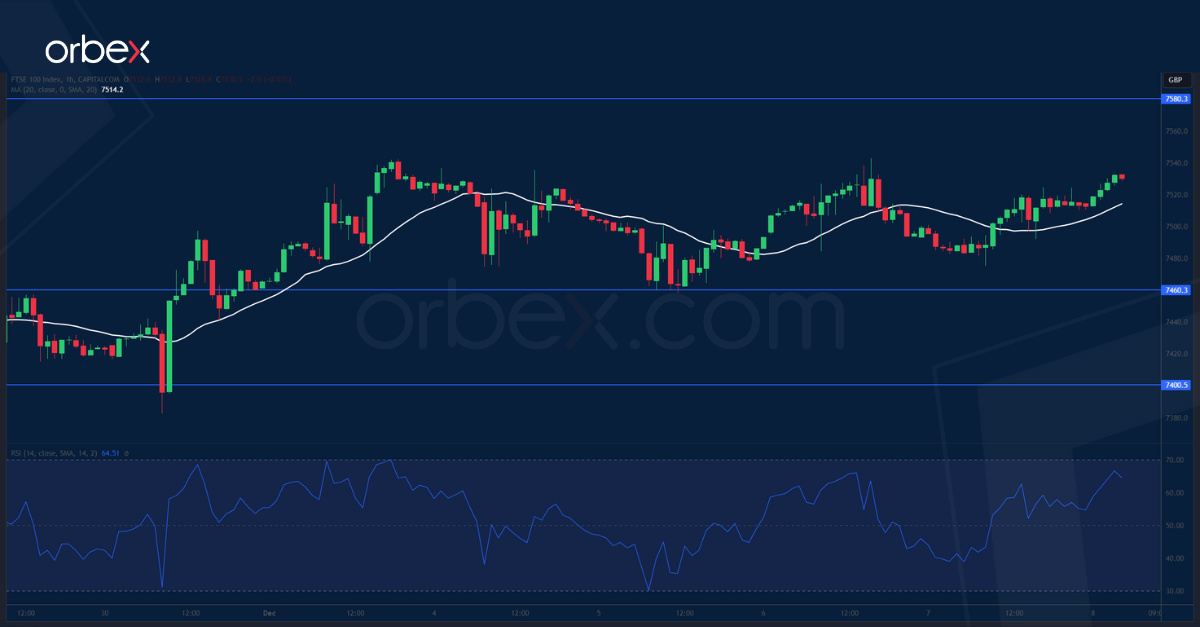
The FTSE 100 consolidates as investors hold breath ahead of US payrolls amid growing rate cut expectations. The index so far has held onto its gains after a tentative break above 7540. A series of higher lows with the latest being at 7460 indicates mounting buying pressure as the price is still recovering from the mid-October liquidation. 7580 is the next threshold to clear should the bulls manage to gather renewed interests then the previous peak of 7700 would be the level that stands before a bullish continuation in the medium-term

