
USDCHF awaits breakout
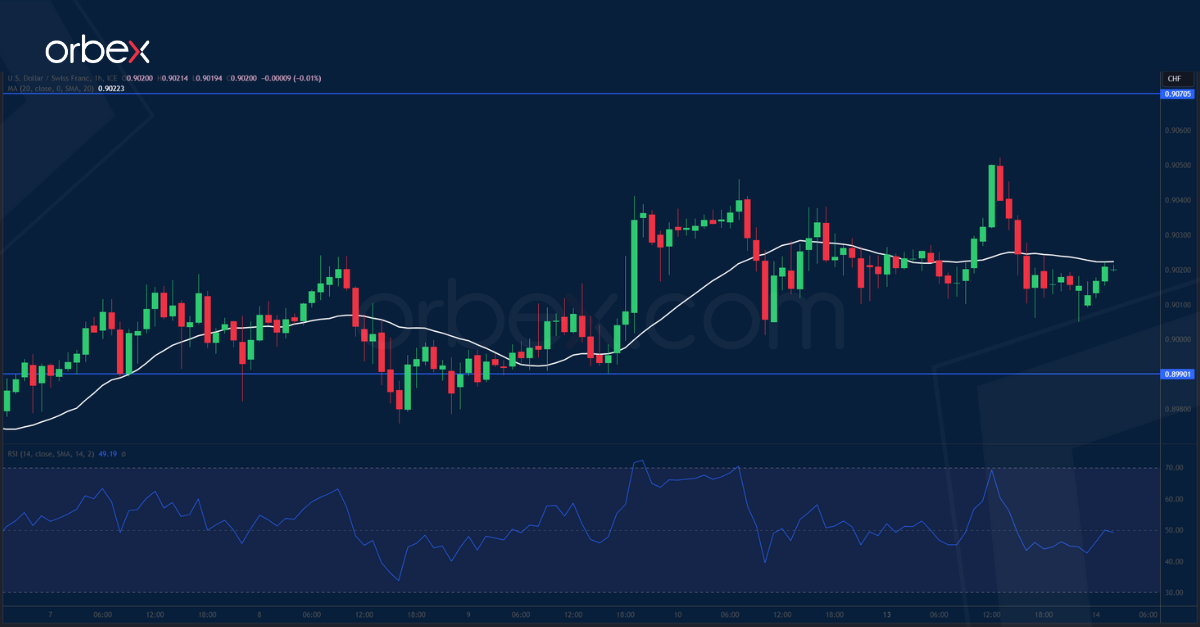
The US dollar holds steady as traders brace for the October inflation reading. On the daily chart, the price seems to be in a triangle consolidation between 0.8900 and 0.9230. The narrowing range is a sign of momentary equilibrium and an eventual breakout would dictate the next directional move. 0.9070 is the nearest resistance and its breach would expose 0.9110, bringing the greenback close to a bullish continuation. On the downside, 0.8990 is a key support to avoid a prolonged correction.
USOIL probes resistance

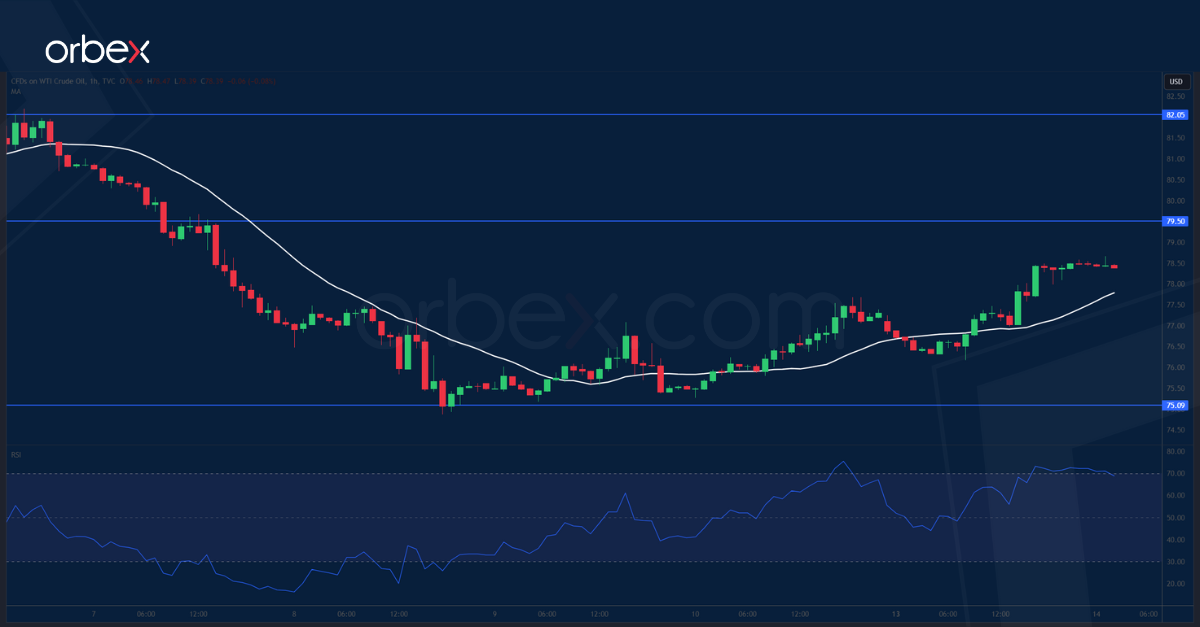
WTI crude edged higher after OPEC’s latest report expressed optimism about fundamentals. 75.00 near the base of a breakout rally last summer has offered the buy side some respite with the RSI recovering into the neutral area. The demand-turned-supply zone around 79.50 is the first hurdle to lift to ease the bearish pressure. Further up, strong resistance could be expected near 82.00 which coincides with the 20-day SMA as sentiment remains cautious. Only its breach would force sellers out and lead to a sustained rebound.
UK 100 attempts to bounce
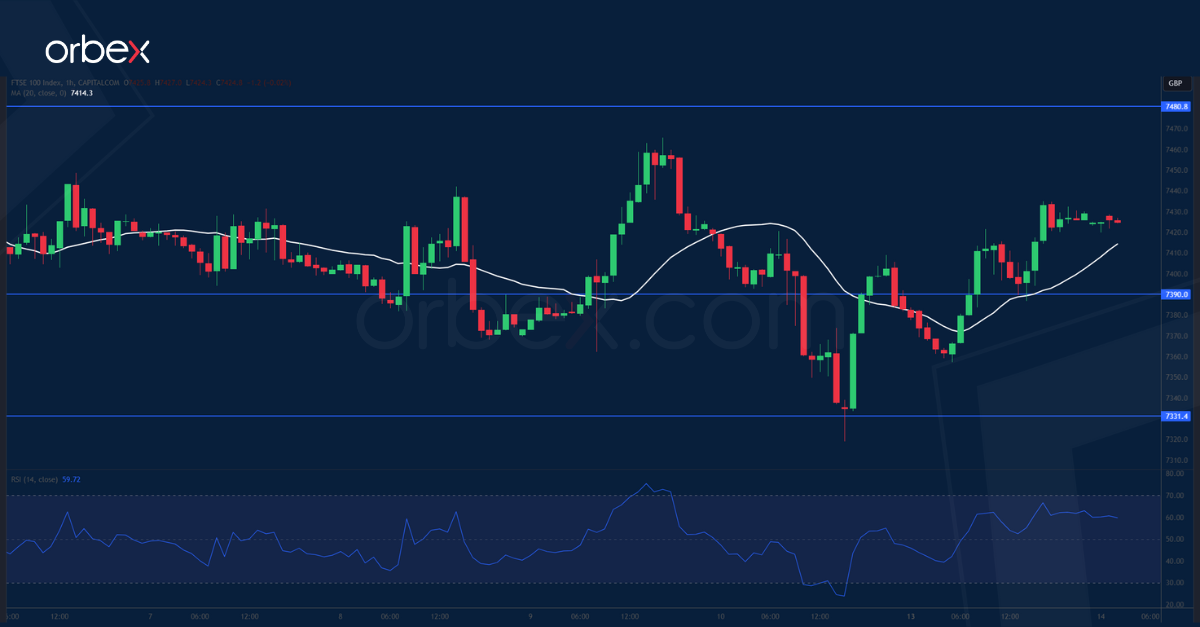
The FTSE 100 recoups losses as traders reposition ahead of jobs and inflation data. The bounce has met stiff selling pressure in the supply zone 7480-7530 as previously trapped buyers sought to exit with little losses. 7390 is the latest to keep the momentum intact as a bearish breakout would put at risk the quadruple bottom of 7260, leading to a potential bearish reversal in the medium-term. However, if the buy side manages to clear the said supply area, an extended rally could carry the index to the October peak of 7700.

