
EURUSD shoots higher
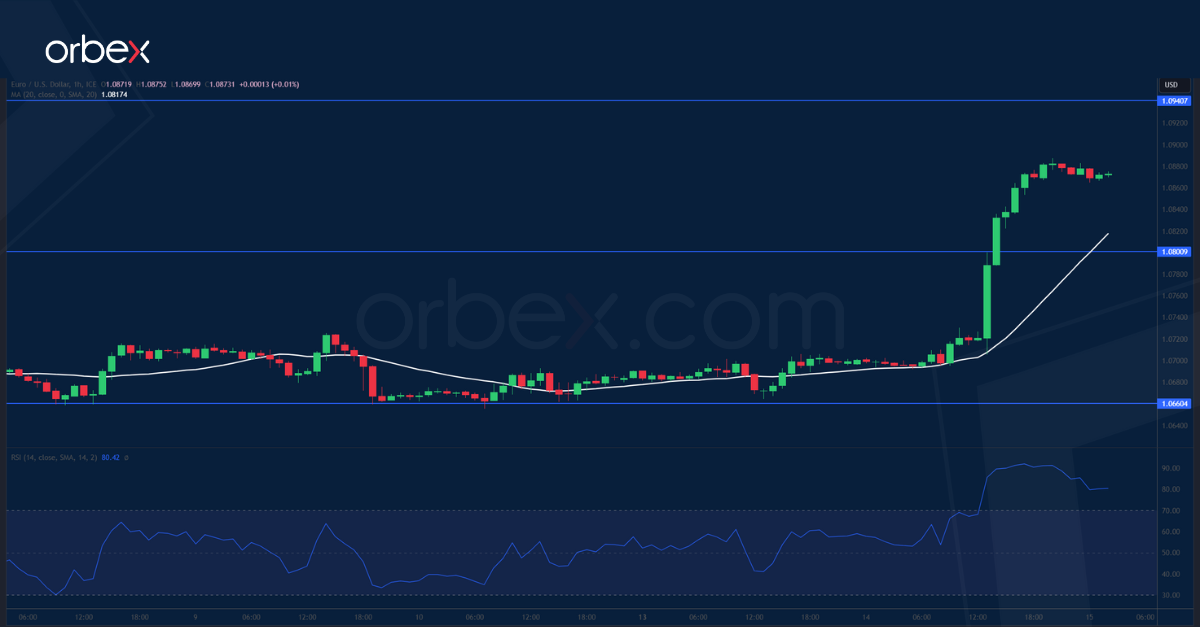
The US dollar plunged after a further slowdown in the pace of inflation in October. The pair had previously secured a solid holding above 1.0660 which sits at the confluence of the 20-day SMA and the base of the bullish breakout earlier this month. A jump above the recent high of 1.0750 triggered strong momentum buying and opened the door to a brief swing high (1.0940) at the end of August. As the RSI ventures deeply into the overbought area a pullback towards 1.0800 might be necessary for the bulls to catch their breath.
XAUUSD bounces back

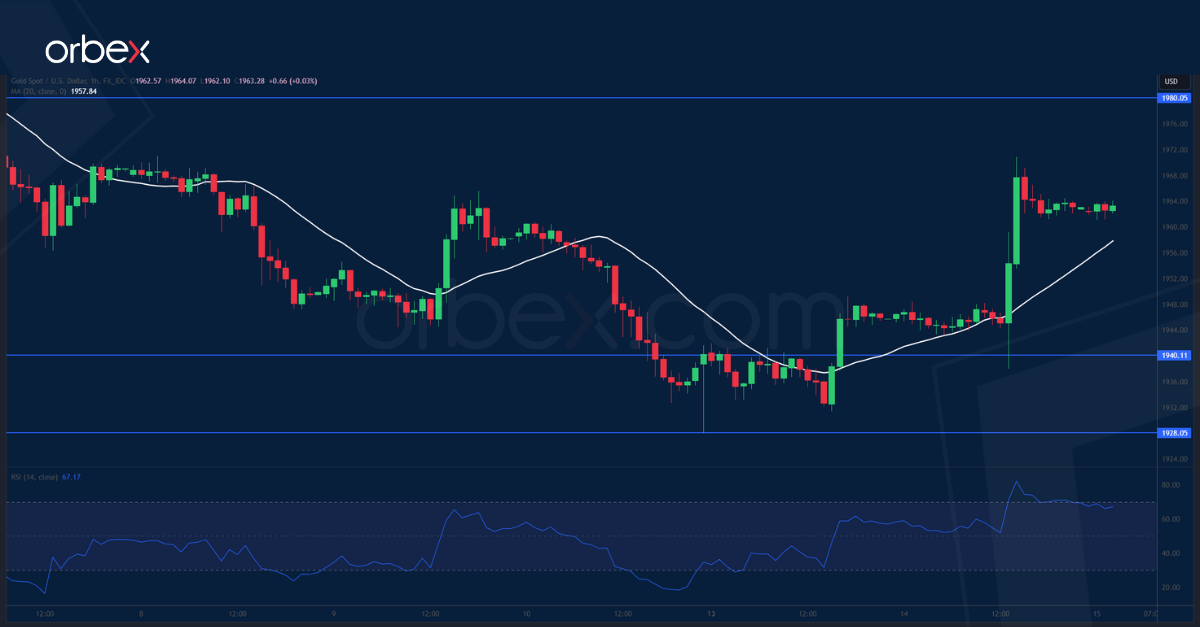
Gold jumped back as the dollar index fell amid cooling US consumer price growth. On the daily chart, the price has bounced off the origin of its breakout in mid-October. The demand zone 1930-1940 is important in keeping the bulls’ hopes and dreams intact. A close above the first hurdle at 1965 would ease the pressure and raise the odds that buyers might take over soon. The RSI’s overbought condition may cause a temporary retreat as intraday buyers exit. A rally above 1980 would bring the psychological level of 2000 to the test.
SPX 500 breaks higher
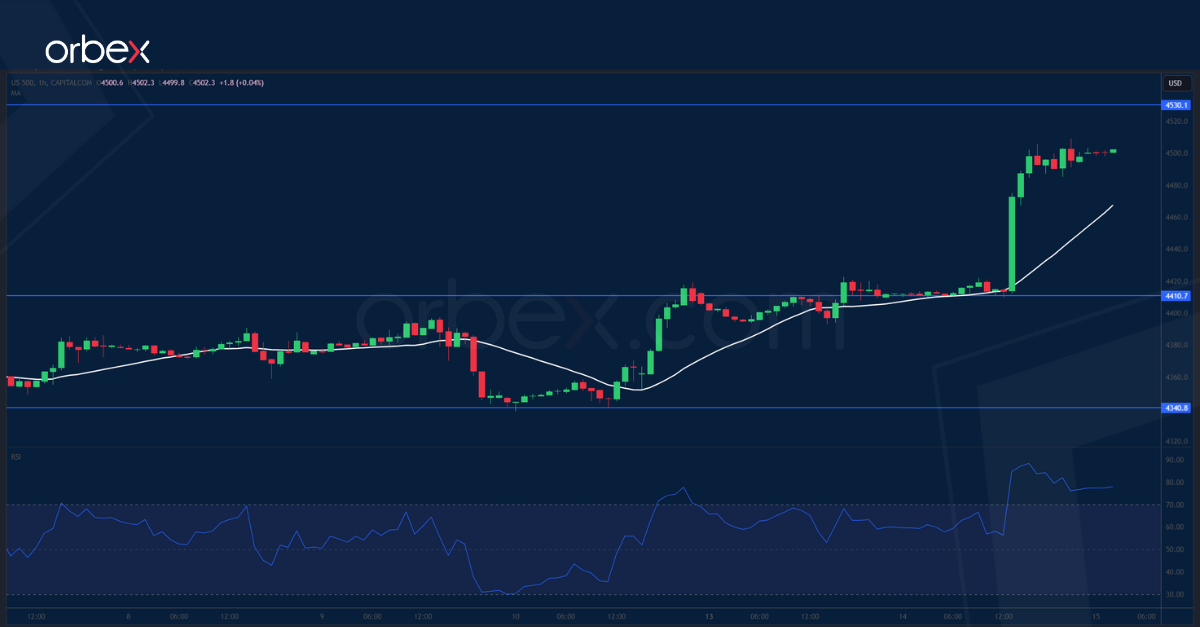
The SPX 500 soared as investors are eager to price in rate cuts for the upcoming year. A brief retreat from the October high of 4400 was not enough to deter the bullish fever, rather it seemed to be an opportunity for accumulation with a swift bounce off 4340. A decisive bullish breakout has prompted a number of bears to close their bets, paving the way for an extended V-shaped recovery. September’s top of 4530 is the next stop before the index could advance to 4600. 4410 would be the first support to expect follow-up buying.

![Credit Card 160×600 [EN]](https://assets.iorbex.com/blog/wp-content/uploads/2023/06/13144507/Blog-Banner_EN-Banner_160X600X2.webp)