
NZDUSD tests critical floor
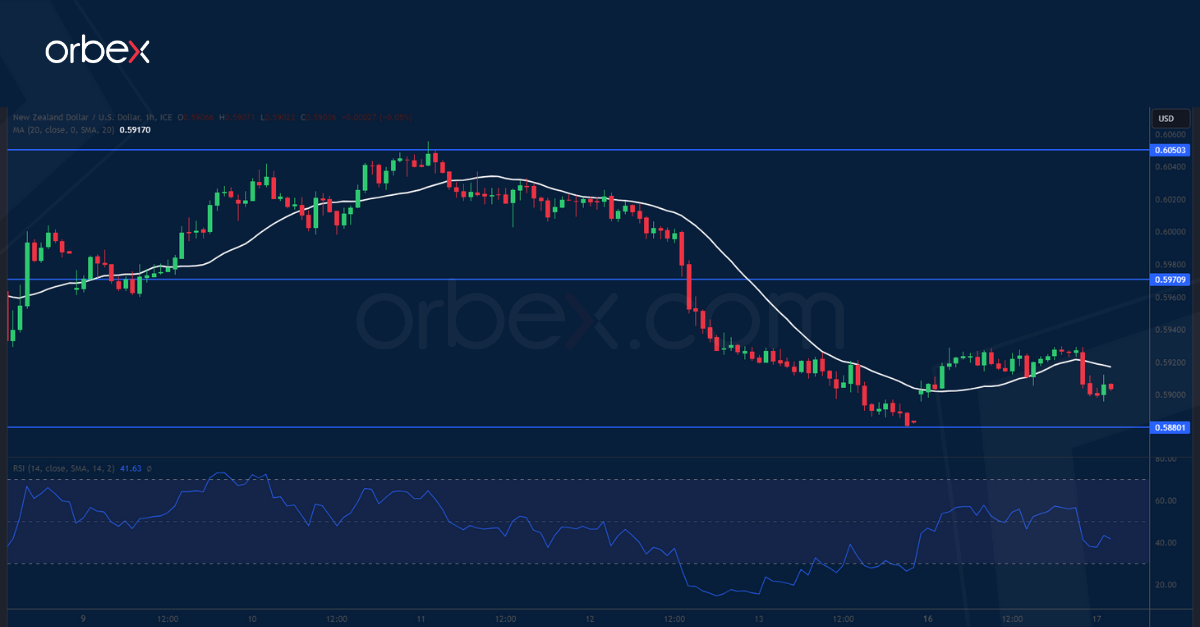
The New Zealand dollar stalled as CPI readings in the Q3 fell short of estimates. The pair is striving to hold onto its October rebound as the bid revisits the bottom at 0.5880. As the RSI sank into the oversold area, a combination of profit-taking and bargain hunting in this demand zone has kept the kiwi afloat. The support-turned-resistance of 0.5970 is the hurdle to clear to help the bulls regain control. Otherwise, a fall below said support would signal a bearish continuation and trigger a new round of sell-off towards 0.5750.
USOIL bounces back

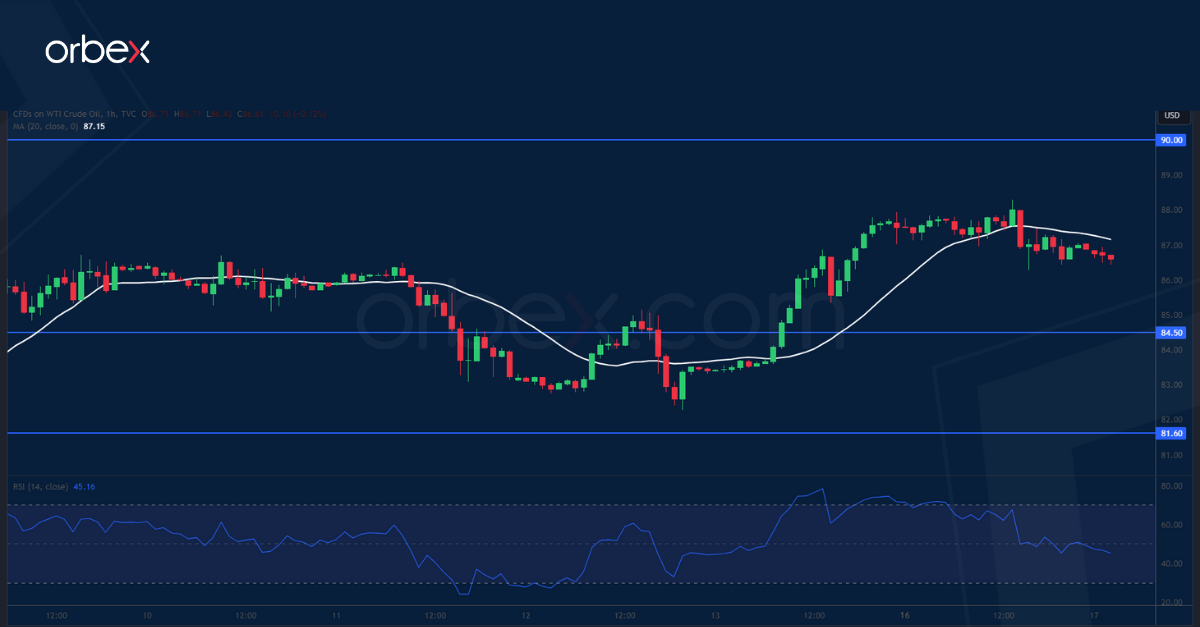
WTI crude rallies as traders worry about potential complications in the Middle East. On the daily chart, the price has secured a foothold at 81.60 at the base of a breakout rally at the end of August. A subsequent swing above 87.00 has prompted more sellers to cover their positions as a lack of a lower low indicates that the bulls might have gained buying power. The confluence of the psychological level of 90.00 and the tip of a brief rebound could be the bears’ last stronghold. 84.50 is the immediate support in case of a pullback.
US 30 builds base
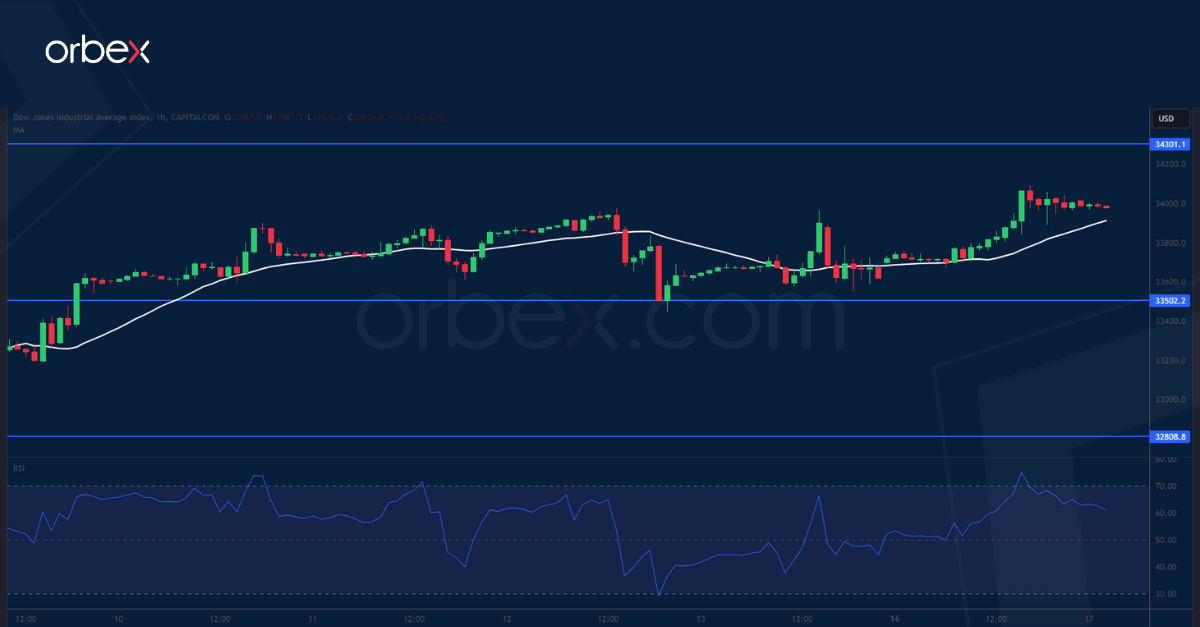
The Dow Jones 30 claws back some losses as investors embrace the third quarter earnings season. The quote is making its way back from its 5-month low of 32800 which is an important level to keep the bullish bias intact in the medium-term. A break above the first resistance of 33900 has eased some of the downward pressure and the next stage is to see if there is enough follow-through to further sustain the bounce. 33500 is the closest support and a rise above 34300 would expose the double top at 35000.

![Credit Card 160×600 [EN]](https://assets.iorbex.com/blog/wp-content/uploads/2023/06/13144507/Blog-Banner_EN-Banner_160X600X2.webp)