USDCAD breaks key resistance
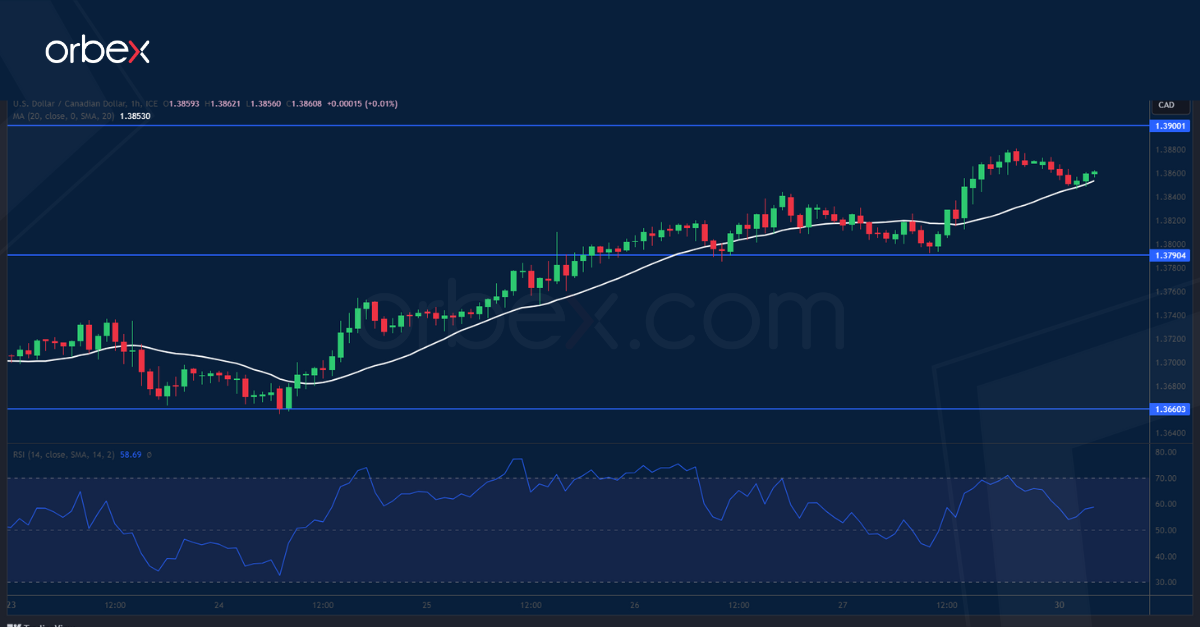
The US dollar advanced further after steady core PCE in September suggested persistent inflation pressure. The price has lifted offers around last March’s peak of 1.3860 and would force the bears to throw in the towel, paving the way for a bullish continuation above 1.3900 then 1.4000. In the near term, the RSI has ventured again in the overbought area and may cause a limited pullback should intraday buyers take some chips off the table. 1.3790 is the first support to gauge the strength of follow-through interests.
XAGUSD holds onto gains

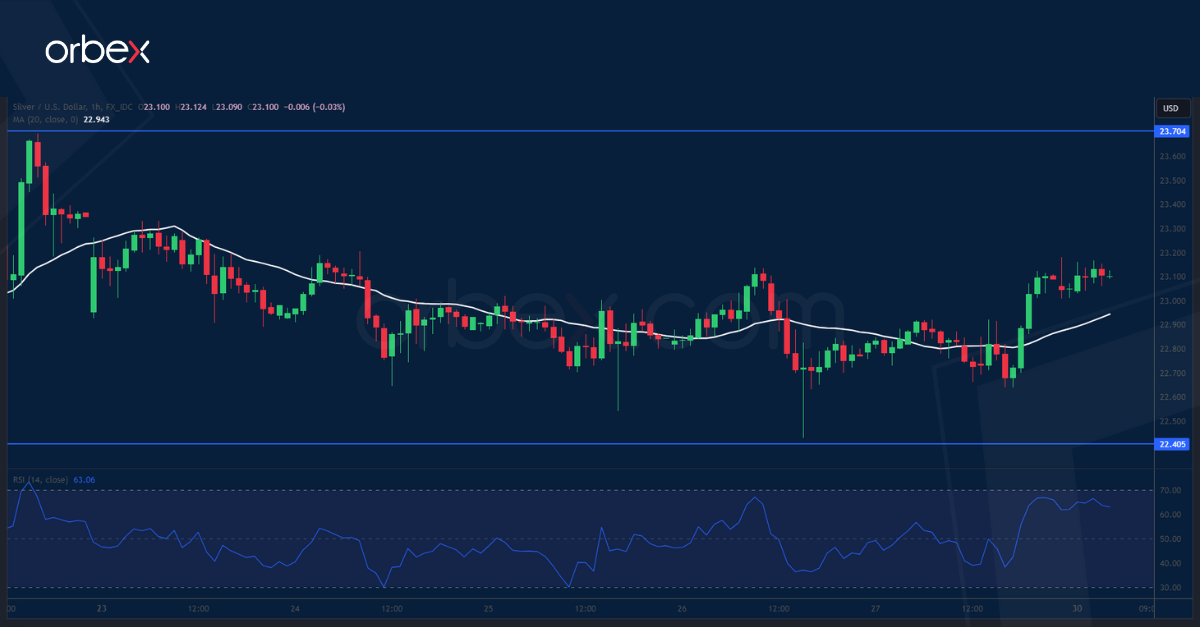
Silver bounced back as an escalation in the Middle East weighed on risk sentiment. The latest rally came to a halt at the daily resistance of 23.70, at the origin of the second leg of sell-off in late September, probably due to a combination of profit-taking and fresh selling in this significant supply area. 22.40 has seen some buying interests reemerging with 21.80 as the second layer of defence to prevent a deeper correction. A break above 23.70 would put the metal back on track and extend the rally to the August peak of 25.00.
GER 40 tests critical floor
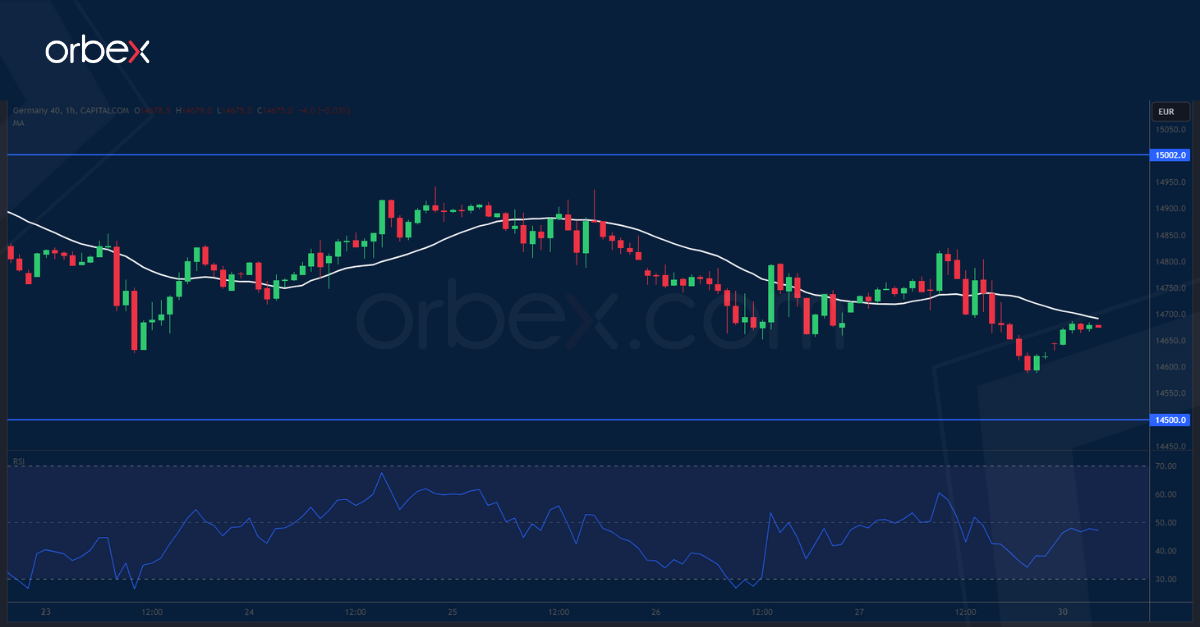
The Dax 40 weakens as geopolitical tensions compound high bond yields. On the daily chart, the index is hovering above last March’s swing low of 14500. This is a critical floor to keep the price action afloat in the medium-term as a bearish breakout would trigger a broader liquidation. The RSI’s repeated oversold condition in conjunction with the demand zone may attract those looking to buy the dip in the hope of a bounce. The psychological level of 15000 is the first obstacle to clear to turn the short-term mood around.

