
EURUSD snaps back
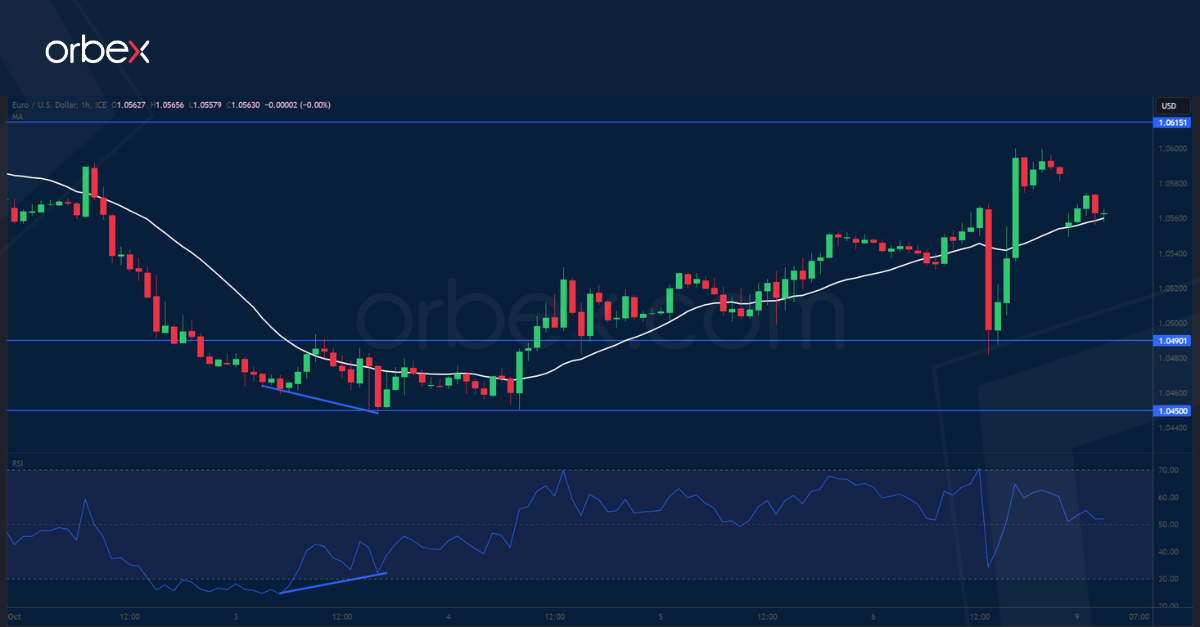
The US dollar turned south after wage growth slowed down in September. A near three month long retreat has dented the market’s optimism about the euro but an oversold situation on the daily chart could present an opportunity for a rebound. A bullish RSI divergence indicates a slowdown in the sell-off momentum. 1.0615 on the 20-day SMA is a key resistance and its breach would prompt sellers to take some heat off the single currency. The latest inflection point of 1.0490 is a fresh support to maintain the recovery bias.
USDCAD probes support
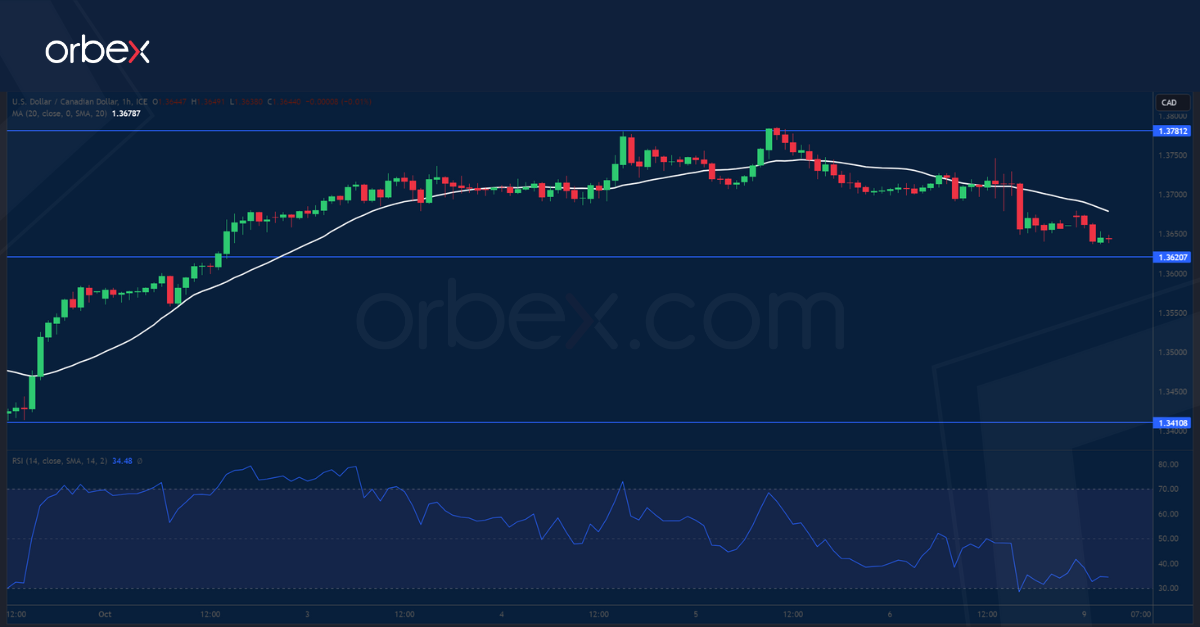
The Canadian dollar rallied on stronger-than-expected jobs data last month. The US counterpart’s surge above the September peak of 1.3690 may have helped medium-term bulls reclaim control of the direction. This has brought the greenback next to the double top formed by last October’s and March’s highs, where a breakout may resume the uptrend after a year of sideways action. In the meantime, a fall off 1.3780 means that the former support zone around 1.3620 is the first support to expect follow-through bids.

US 30 finds support
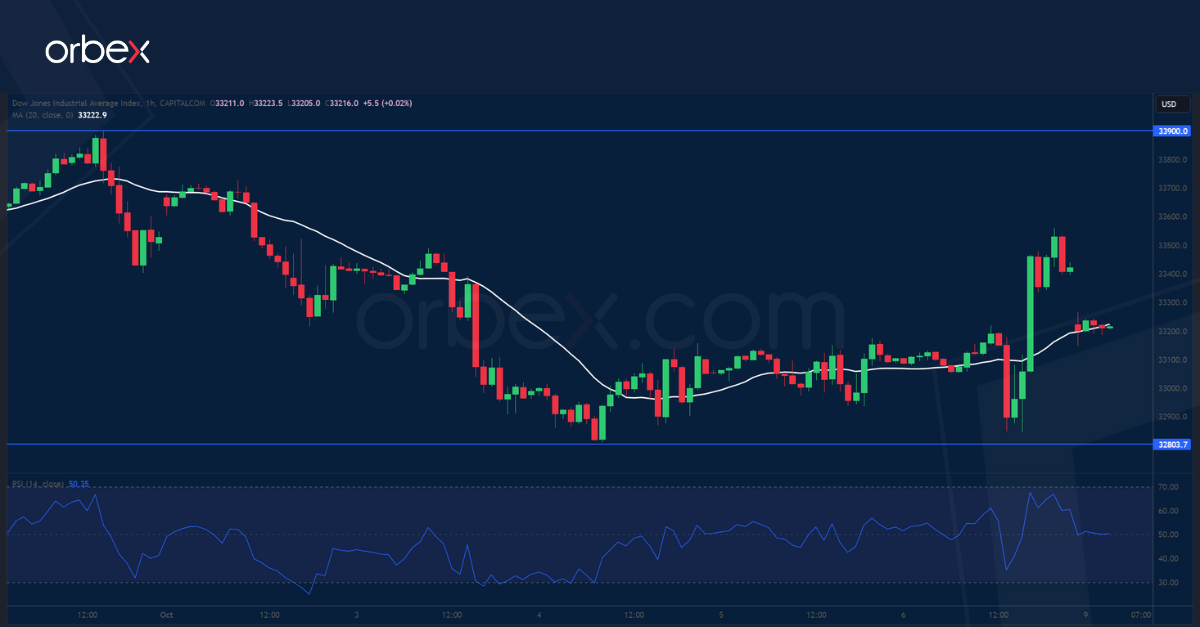
The Dow Jones soared as an uptick in the US unemployment rate confirms a slower economy. The index is hovering above the demand zone 32600-32800 from last May’s low. This is an important support to keep the bids afloat as a bearish breakout would force buyers to bail out in mass and trigger a deeper correction to 31500, putting this year’s rally at risk. A close above 33500 has flushed out some sellers and helped the bulls regain confidence. The support-turned-resistance of 33900 on the 20-day SMA is a major resistance.

![Credit Card 160×600 [EN]](https://assets.iorbex.com/blog/wp-content/uploads/2023/06/13144507/Blog-Banner_EN-Banner_160X600X2.webp)