
USDCHF probes support
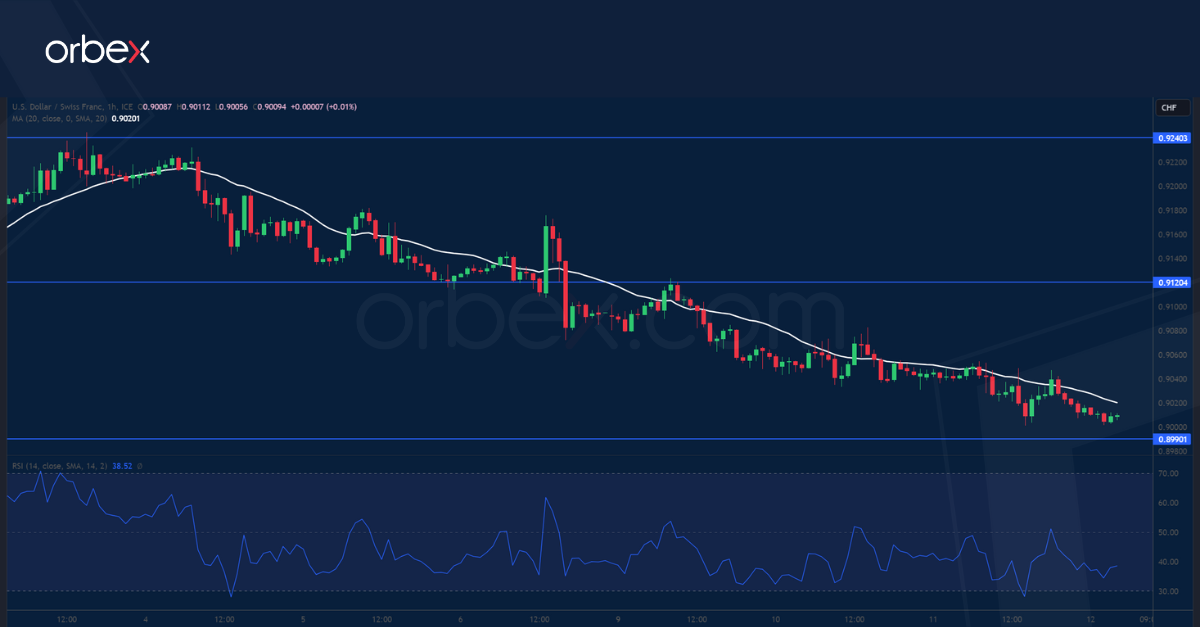
The US dollar drifts lower as month-on-month producer prices continue to ease. The pair is still pulling back in search of buyers after lifting offers near June’s high of 0.9120. 0.8990 at the base of a bullish breakout impetus in late September is the next step to see if buyers would manifest their interest. Otherwise, a deeper correction may push the greenback below 0.8900. On the upside, the support-turned-resistance of 0.9120 is the key level to clear to turn the short-term mood around and resume the climb.
XAUUSD tests key resistance

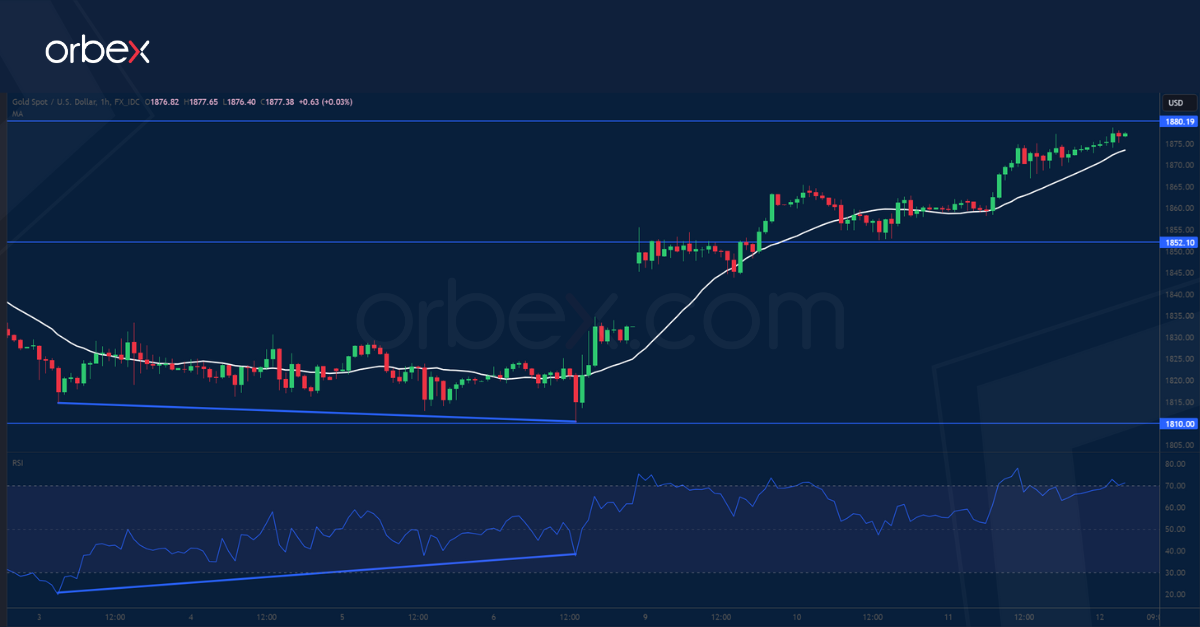
Bullion advanced as the Fed minutes showed policymakers struck a cautious stance amid slowing growth. The price so far has found a foothold at the March low of 1810. A bullish RSI divergence in this important demand area indicates that the sell-off has eased. A combination of profit-taking and bargain hunting has popped up demand for gold. 1880 on the 20-day SMA is the resistance to clear to interrupt the bearish drive and lay the foundation for a sustained recovery. 1852 is the closest support in case of a pullback.
UK 100 bounces higher
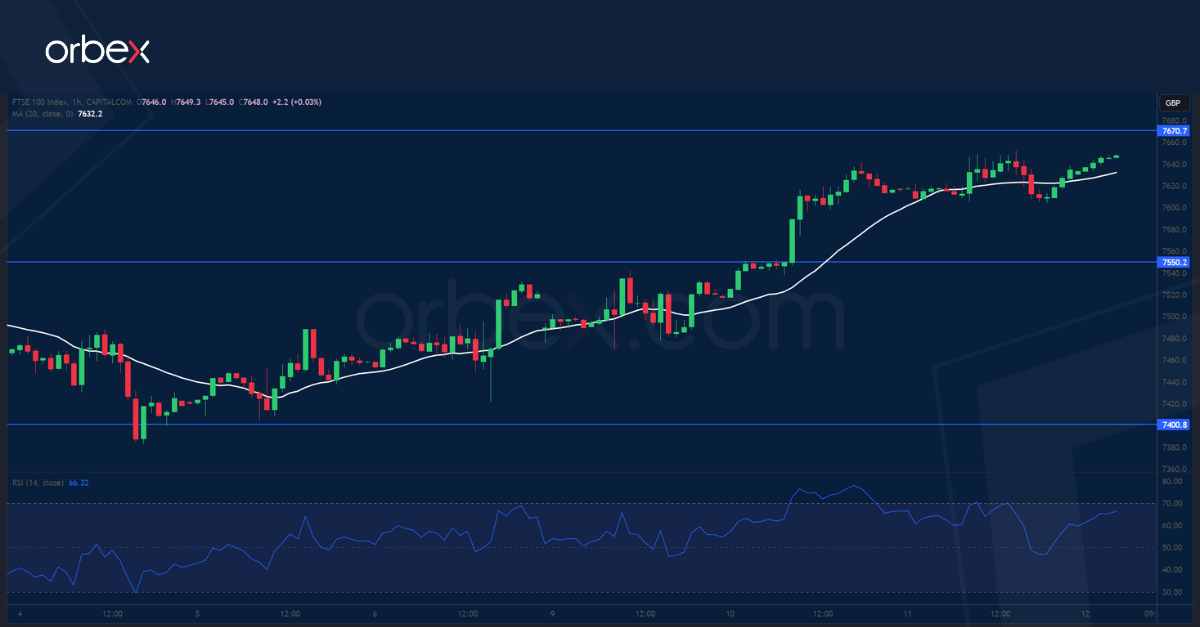
Global equities bounce back as US Treasury yields fell to a two-week low. The FTSE 100 is testing the tip of a previous limited rebound at 7670 which is also the start of a sell-off at the end of September. A bullish breakout would put under pressure the remaining offers near the recent peak of 7750, and its breach could lead up to a potential bullish continuation above 7940. In the meantime, the RSI’s overbought condition may cause a retracement towards 7550 should intraday buyers start to take some chips off the table.

