
EURUSD tests recent peak
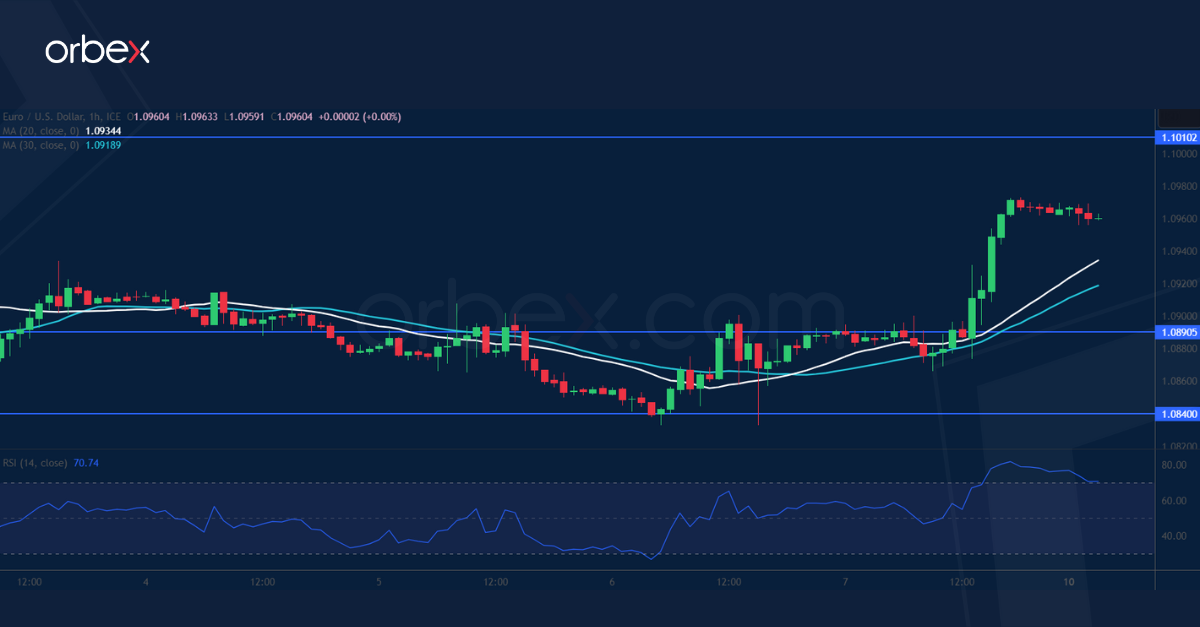
The US dollar plunged after job growth slowed in June. The pair previously found support over 1.0840 at the base of a bullish momentum back in mid-June, which coincided with the 30-day SMA. The directional bias has remained upward from the daily chart’s perspective with a bullish MA cross as a sign of stabilisation in the two-week long consolidation. A pop above 1.0930 has put the single currency back on track and led to a test of the recent peak of 1.1010. 1.0890 is a fresh support in case the bulls need to catch their breath.
GBPCAD aims at year’s peak

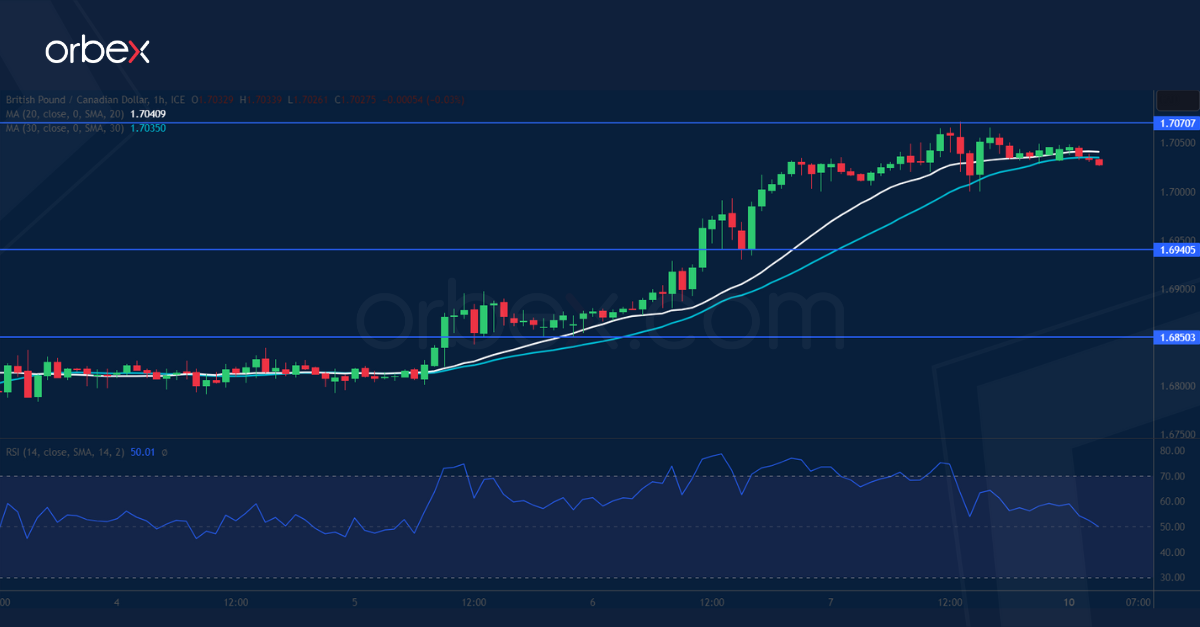
The Canadian dollar slumped as a rising jobless rate may ease the hike pressure on the BoC. A close above the June high of 1.6970 has attracted momentum buyers, sending the pair towards this year’s peak of 1.7140. 1.7070 is the intermediate hurdle in its way and the RSI’s overbought condition could prompt the bulls to take some profit. The support-turned-resistance of 1.6940 is the first level to expect renewed buying interest and 1.6850 on the 20-day SMA would be the bulls’ second line of defence.
GER 40 sees liquidation
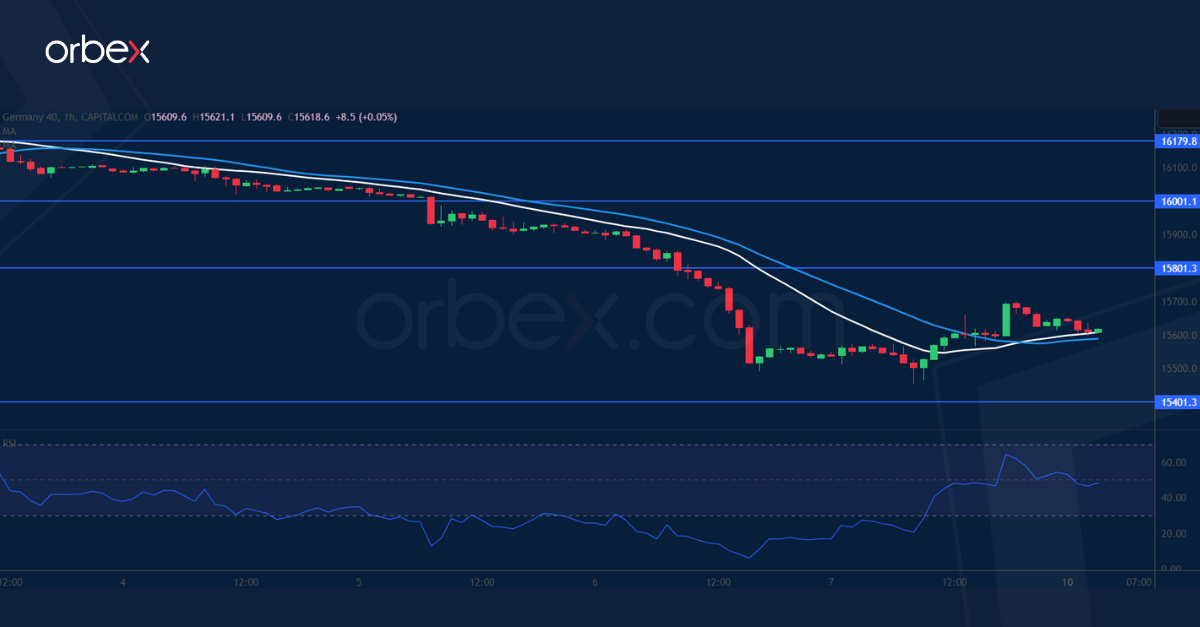
The Dax 40 tumbled as central banks’ recent hawkish messages drove bond yields higher. A sharp fall below the demand zone 15650-15700 from a previous lengthy consolidation is a sign of capitulation by short-term bulls. The RSI has recovered into neutral territory as sellers took profit, but the index is yet to stabilise as traders might be wary of catching a falling knife. The start of a breakout rally (15400) at the end of March is the level to see if buyers are making their way back, and 15800 is the first hurdle to clear.

