
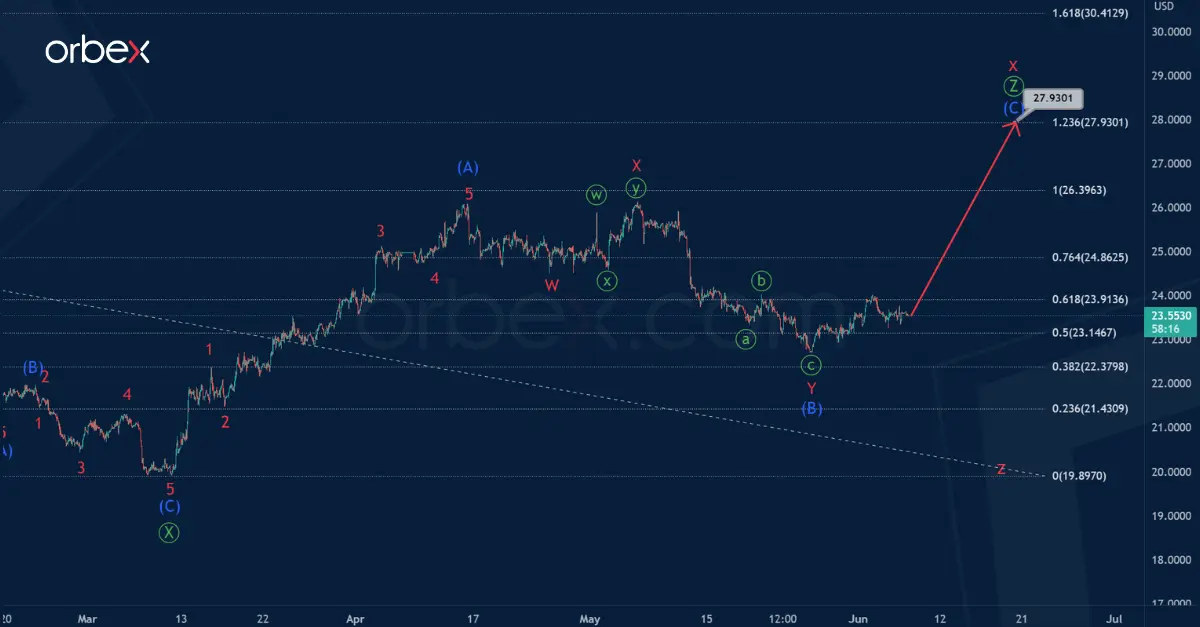
In the long term, XAGUSD is forming a corrective trend consisting of cycle waves w-x-y-x-z.
At the moment we see the construction of an intervening wave x. This takes the form of a triple zigzag Ⓦ-Ⓧ-Ⓨ-Ⓧ-Ⓩ of the primary degree.
The primary wave Ⓩ is in the development stage. Perhaps this wave will be a standard zigzag, where the impulse and correction have ended. Wave (B) is a double zigzag.

In the coming days, growth is expected in (C) approximately to 27.930, where the primary waves Ⓩ and Ⓨ will be equal.
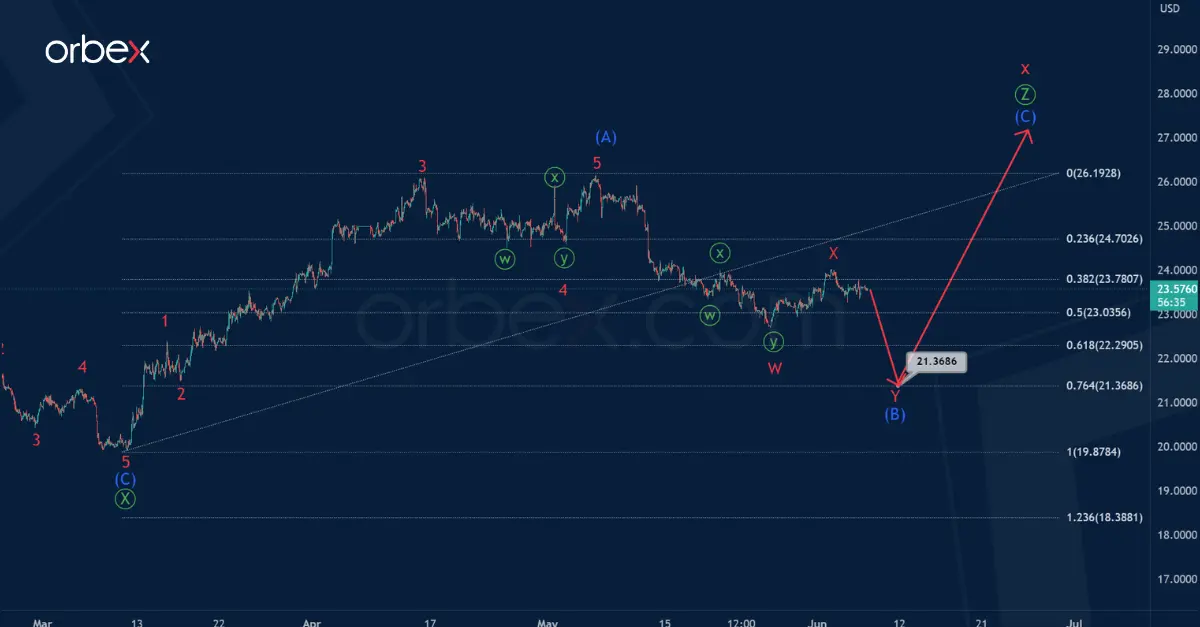
Let’s consider an alternative scenario in which the development of the intermediate wave (B) continues. It looks like a double zigzag, in which the sub-waves W and X are completed.
In the near future, a decrease is expected in the final actionary wave Y.
It is assumed that the intermediate correction (B) will be at 76.4% of impulse (A), and will end near 21.368.

![Credit Card 160×600 [EN]](https://assets.iorbex.com/blog/wp-content/uploads/2023/06/13144507/Blog-Banner_EN-Banner_160X600X2.webp)